VOLTAS - Weekly AnalysisIn the Weekly Chart of VOLTAS ,
we can see that, it is converted from down trend to Up trend.
It is holding strongly at 200 EMA.
Since 920-930 levels have been tested multiple times, we can see a further up move in coming weeks.
Go Long for VOLTAS.
VOLTAS trade ideas

7857 Reason for longReason for long
a) Flag pattern and triangle breakout possible
b) false low propels upside breakout
c) vwap suppot
d) weekly breakout possibility
SL compulsory

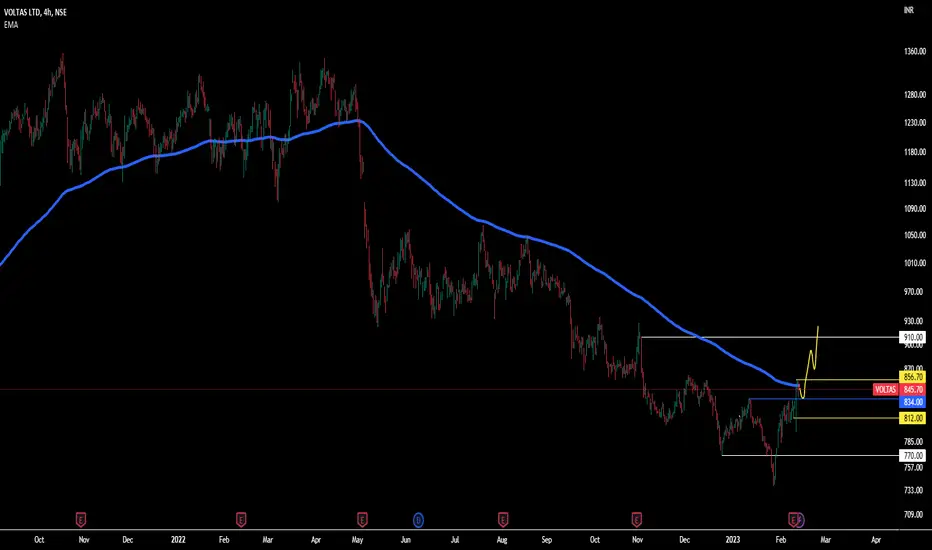
$VOLTASbreak 856.7 and fly but before that recon we pullback to 833.6-834
not trading this , request chart
basically reclaim 200 ema on the H4 then fill the gap to 200 ema on the daily
Neat & Clean Breakout Seen in Voltas|this is going in sky.About Company:-
Voltas is engaged in the business of air conditioning, refrigeration, electro - mechanical projects as an EPC contractor both in domestic and international geographies (Middle East and Singapore) and engineering product services for mining, water management and treatment.
Technical @ Fundamental Analysis:-
We have seen falling trendline breakout in Voltas with huge Volume and MACD bullish crossover,,this all indicate a bullish momentum in Voltas..Price also got retested and move upward after breakout this is another positive indication. So now as we are getting this much positive signals from price action and indicators then definitely we can assume Voltas has taken U turn and now chances are very less to go down and make another low in recent time.
Market Cap
₹ 28,120 Cr.
Current Price
₹ 850
High / Low
₹ 1,348 / 737
Book Value
₹ 169
Dividend Yield
0.65 %
ROCE
13.0 %
ROE
9.62 %
Face Value
₹ 1.00
Debt
₹ 393 Cr.
EPS
₹ 5.25
PEG Ratio
-743
Promoter holding
30.3 %
Intrinsic Value
₹ 131
Pledged percentage
0.00 %
EVEBITDA
42.8
Company is almost debt free.
Company has been maintaining a healthy dividend payout of 31.1%
Guy's if you like my work Please like,follow and comment your thoughts about this ticker and my work.
Thankyou:))

Voltas view for 22nd Feb WednesdayVoltas view for 22nd Feb Wednesday
Breakout already happened in Voltas. Again upside view above 902 if sustain then
Charts for Educational purposes only
Please follow strict risk reward and stop loss if you follow my level
Thanks,
V Trade Point

7785 Triangle breakoutReason for long
a) Daily time frame, price broken from consolidation and today candle formed like pull back.
b) In smaller time frame, price pattern formed the lower low and triangle formation.
c) vwap support is another catalyst to aid for up trend.
SL compulsory

Voltas on its way to breakout Voltas Ltd was on our radar for upcoming week bcs RSI and trend line make breakout but we wait for resistance (most imp) breakout. A good buying volume also see in it.
Buy it above 861
Target 880 910 930 965
Sl 830

VOLTASIn the Weekly Chart of VOLTAS ,
we can see that, finally we saw a recovery in W shape.
let it retest and then plan to enter with SL.
Go Long for VOLTAS.

VOLTAS Buy for intraday tradingVOLTAS Buy for intraday trading if stock break the given resistence level..............

bro i have found channel breakout on voltas be ready for bullish breakout happen to be ready for comment me stock analysis
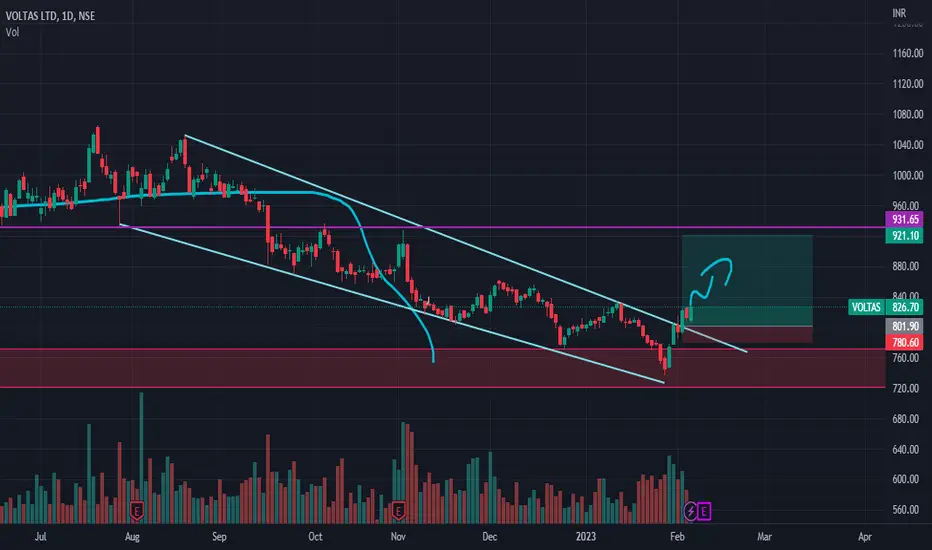
VOLTAS Swing TradeVoltas recently broke a trendline.
And it has been a range for some months if it breaks and sustains above it we can go long.
I'm taking an entry at 825 SL 787.
Watch out for 200 EMA which can act as a resistance breaking that can be another confirmation of this swing trade.
if it takes rejection from the 200 EMA trail your SL or book your profits.
For more details refer to the image.
Comment below if you have any questions or queries.
Happy Trading !

Voltas view for today 6th FebVoltas view for today 6th Feb
Descendin channel continuation expecting in Voltas
Please follow strict risk reward and stop loss if u follow the level
Thanks,
V Trade Point


voltas india wait and watch for entry this is one of the best stock to buy its based on the technical so wait and watch

VOLTAS WEEKLY CHART1 week chart In this chart all the Resistance and Support zone are drawn in the chart may we get some ideas to take trade in this stock.

7277 TST set upReason for long
a) Test support test (TST) Set up
b) good risk reward zone
c) bear bar are small and less volume and are weak
d) SL compulsory

we are on short side zone in voltaswe are on short side zone in voltas
daily time frame close need to maintain below our red zone

7398 Pin bar at supportReason for long
a) Pin bar formation at support
b) volume and price inline with direction reversal for long
SL compulsory

Long setup for voltasThe chart pattern its showing bullish momentum in price action. after the breakout, it can give a good risk: reward ratio.
Entry price:- above @803
Stop loss:- @790
Target:- 1:1 or 1:2

Go long after w pattern otherwise double bottom Wait for double bottom ya changing of character means bullish higher high formation '
Wait for 770 '
Stop loss 750,

VOLTAS Voltas is forming new HH and HL. If stock takes support on Fib Level 0.618 then stock may reverse till the level of 1356.90 (If market shows bullishness)

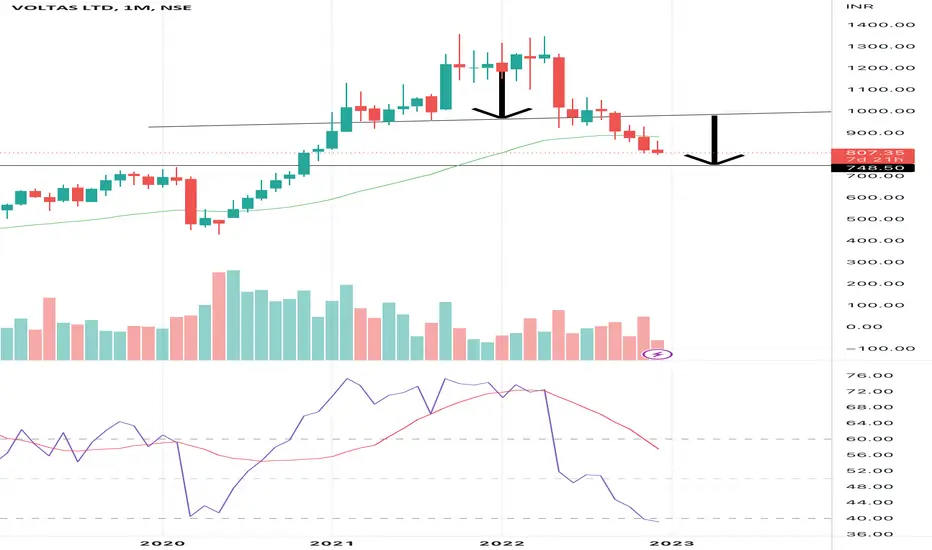
'Sell formation head and shoulder pattern in monthly chartTarget already post
You can buy near support only
748 buy price
VOLTAS in the buying ZoneVoltas is forming divergence, however not as strong as desired. But it gives a good buying opportunity for positional trades here. I will buy 25% of my intended investment for Voltas here and keep buying if new lows and divergences found. But, I wont buy and just hold what I have bought if it moves up from here.
There is no stop loss, as I will keep averaging for another 75% and then hold.
One year target at least 20-30%
Will keep updating !!!
