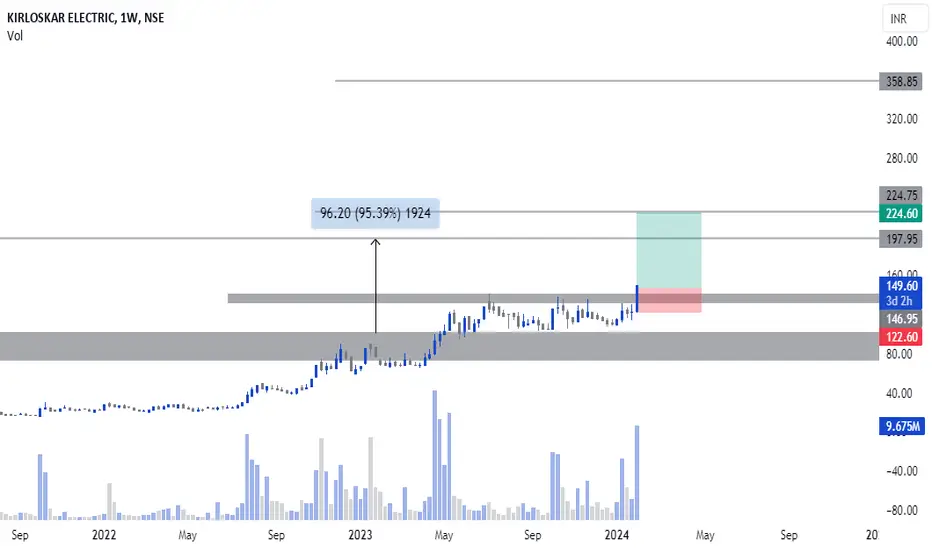
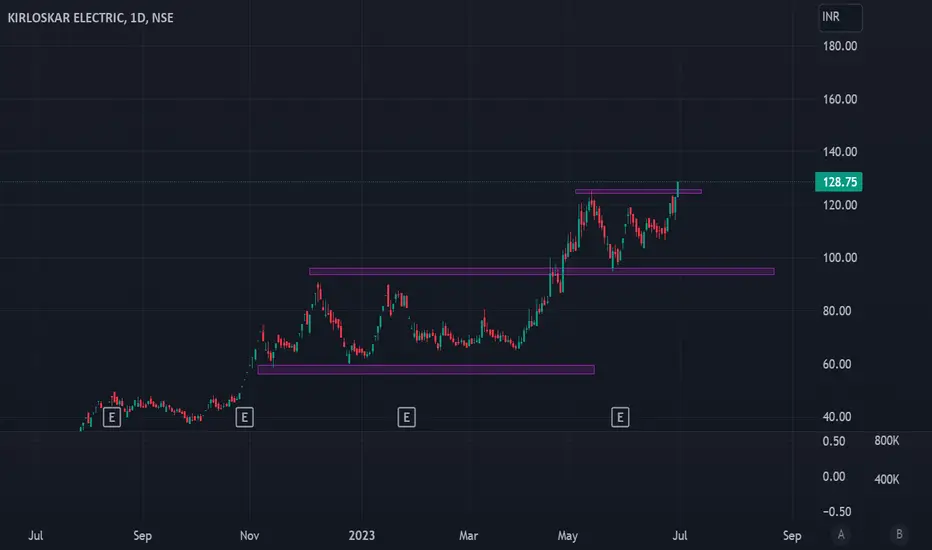
Kirloskar ElectricKIrloskar Electric is about to break today . If break happens and remains above 126 the price will shot up again . As the price had broken and holded above monthly high .
KECL trade ideas

Triangle Pattern Correction : Elliott Wave A triangle appears to reflect a balance of forces, causing a sideways movement that is usually associated with decreasing volume and volatility. The triangle pattern contains five overlapping waves that subdivide 3-3-3-3-3 and are labeled A-B-C-D-E. A triangle is delineated by connecting the termination points of waves A and C, and B and D. Wave E can undershoot or overshoot the A-C line, and in fact, our experience tells us that it happens more often than not.
Types of Triangles
There are three varieties of triangles: contracting, barrier and expanding, as illustrated in Figure 1. Elliott contended that the horizontal line of a barrier triangle could occur on either side of the triangle, but such is not the case; it always occurs on the side that the next wave will exceed. Elliott’s terms, “ascending” and “descending,” are nevertheless useful shorthand in communicating whether the barrier triangle occurs in a bull or bear market, respectively.
Figure 1 depicts contracting and barrier triangles as taking place entirely within the area of preceding price action, which may be termed a regular triangle. Yet, it is extremely common for wave B of a contracting triangle to exceed the start of wave A in what may be termed a running triangle, as shown in Figure 2. Despite their sideways appearance, all triangles, including running triangles, effect a net retracement of the preceding wave at wave E’s end.

KECLThis stock breakout 12 years level and W pattern if strong candle closed i am considered good breakout
and this is only for educational purpose only
KECLThis stock breakout 12 years level and W pattern if strong candle closed i am considered good breakout
and this is only for educational purpose only

KECLKECL
taking support near previous high
Breakout candidate on weekly chart after retest and bounce from support

kirloskar opened gate for a bigger moveKIRLOSKAR electric has given a cp and handle breakout
expecting 40 % plus returns from current levels

Necklace Pattern = KECLMy favorite "Necklace Pattern" is getting unfolded in "KECL" on monthly Time Frame. In fact, this Kirloskar Group is seriously re-vamping all its group companies & it's evident in their charts as well!
Referring Monthly TF on BSE Chart since NSE has limited data to study for this scrip.
Cheers!

Recent Breakout in Kirloskar Elec Company with positive RSIt has recently broken out of a base in its weekly chart with huge volumes. A good candidate to take long position with favourable risk:reward.
Can can take position with 90.55 as SL

KECL Kiloskar Electric NSE BULLISHVIEW ABOVE 30.45 CMP 32.8KECL Kiloskar Electric NSE is bullish if 30.5 holds. NEW 52WEEK High. Fresh Breakout. Positive Trend.
Disclaimer: Educational Purpose Only. Not Buy Sell Reco . Not Sebi Registered.


