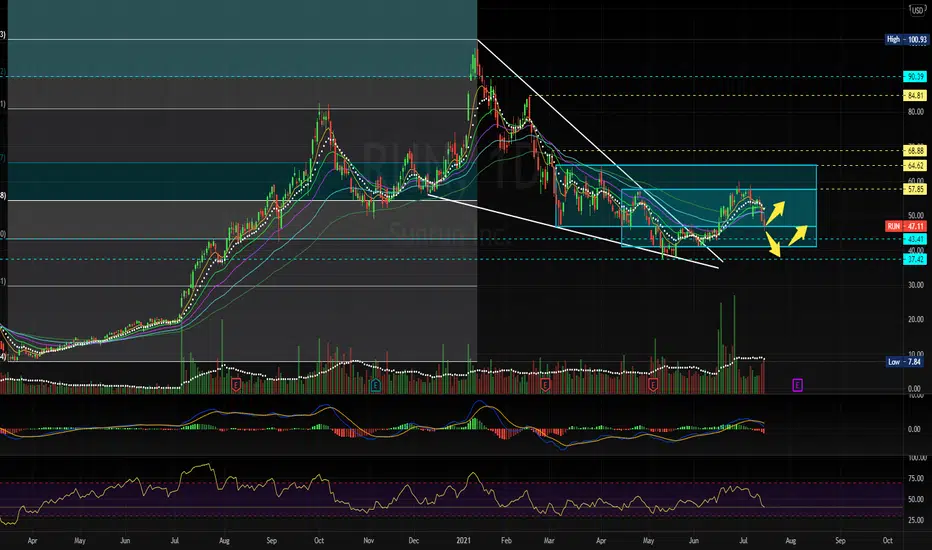
$RUN update : retestingAs posted in last chart. RUN continues to be backtesting.
Two important trading zones here (two blue boxes)
levels are identified by the box edges.
RUN trade ideas
Touch the SunRUN is looking bullish if it stands the support line and the fundamental boost on green energy is still to play in 2021. The last earnings report is also give it a good growth projection.


$RUN - PredictionHere is a prediction I made off the stock forming an inverse head and shoulders using past support and resistance level.

Run 64 test Accumulation has been there .
sentiment is low on this . not too overcrowded
bouncing off the 9 Ma atm ....
if market is in rip mode then this flies.
no 7/2 strike date , have to go with the 7/16
ended green today....


RUN - Daily Chart Feeling bullish on daily chart
Monthly resistance showed as RED line
Daily Resistance showed as Green Line
Swinging Trade
Trailing Stop loss is good deal!.
Thanks
Govind

$RUN Monthly Chart $RUN - Monthly Chart
--Its taking a swing, can go up to the resistance -1 . It can form a Head and Shoulder Pattern if it unable to break it.
--It needs to take higher high in monthly chart to form an uptrend
--Added Fibonacci extension
Thanks
Govind


RUN looks good on daily and weeklyIf goes out of resistance, this will go to $60
Stop: $50.25
If goes below $49, might fall to $45.70


$RUN. Go up!The upside targets are $69, $82.4, $98.
Today the paper broke out of the channel that it has been in since March.
It closed at the point where the 100-day came up to the 200-day and closed above the 51.6, which was the support level.
Also, the volume yesterday was the highest ever.
A pullback to the upper boundary of the channel is possible and then technically there should be a good move upwards.
It's my personal opinion and not investment recommendation.

My View on SunrunRun is trading at $47.73, and huge volume coming.
My short term is,
- Option 1:
I enter the trade at the current price at $47.73 - $48.50, take profit at $56.20. If the price action is very bullish, I will "delete" the take profit and increase stop loss to $50.80. Then. take profit at the target 2.
- Option 2:
I might wait for the price pullback, and test the strong support zone at $46.70, i might enter around $47 to $47.50, and take profit at the target 2.
Comment your ideas please...
-----------------------------------------------------------------------
This is not financial advice. I'm not a Financial Advisor.
Trading is a high risk, do your own DD.
Let me know what you think
Cheers, I would share all my thought next time.
PEACE.

SUN could RUN.Sunrun. looks like to found good support.
i'm buyins some shares here..
safe all
Stone.

SunRun about to Run ?SunRun is in a massive falling wedge, hinting at breakout with the RSI showing bullish divergence.
One of my low risk but longterm plays.
Hope it goes well enough.

$RUN | Falling Wedge: Watch For A Breakout of $44$RUN formed a double bottom after breaking out of a falling wedge
Watch for a breakout of $44 as confirmation
Initial Target $46

7/16 $50 call RUNfalling wedge pattern
entry and exit marked
look for long signal
dont enter if no long signal or if price has not broken entry point

Break out coming, swing tradingEnd of the descending wedge, bullish pattern, 43 support Hold well.
Bullish wolf wave on daily, targeting 60$

$RUN - Potential diving board breakout. Target $63Potential diving board breakout.
Target - $63
———————————————————
How to read my charts?
- Matching color trend lines shows the pattern. Sometimes a chart can have multiple patterns. Each pattern will have matching color trend lines.
- The yellow horizontal lines shows support and resistance areas.
- Fib lines also shows support and resistance areas.
- The dotted white lines shows price projection for breakout or breakdown target.
Disclaimer: Do your own DD. Not an investment advice.

RUN - Potential renewable energy sector reversal LONGRegardless unstable market situation, last couple days renewable energy showing signs of potential growth.
Remember these stocks are still in down trend. Keep your risks low.

RUNInteresting setup going into earnings tomorrow. Chart looks SUPER weak imo. Could start a nasty head & shoulders back down to sub $10s. Would love a gap up tomorrow for an earnings play.

RUN - Bearish continuation in downtrendRUN is in a down trend from ATH. The current set up is a descending triangle that looks to be coiling lower. Resistance has been confirmed three times and a retest of the upper limit is likely. However, it seems more plausible to see a bearish break of the horizontal resistance as the descending triangle is a bearish continuation pattern in the majority of cases. As well, there is hidden bearish divergence on the daily chart.
Fundamentally: earnings could prove to be a catalyst on the heals of the Biden Green Initiatives. However, in reading customer reviews the companies ratings leave much to be desired.
From a technical and fundamental standpoint I am short RUN.
