JFTECH trade ideas


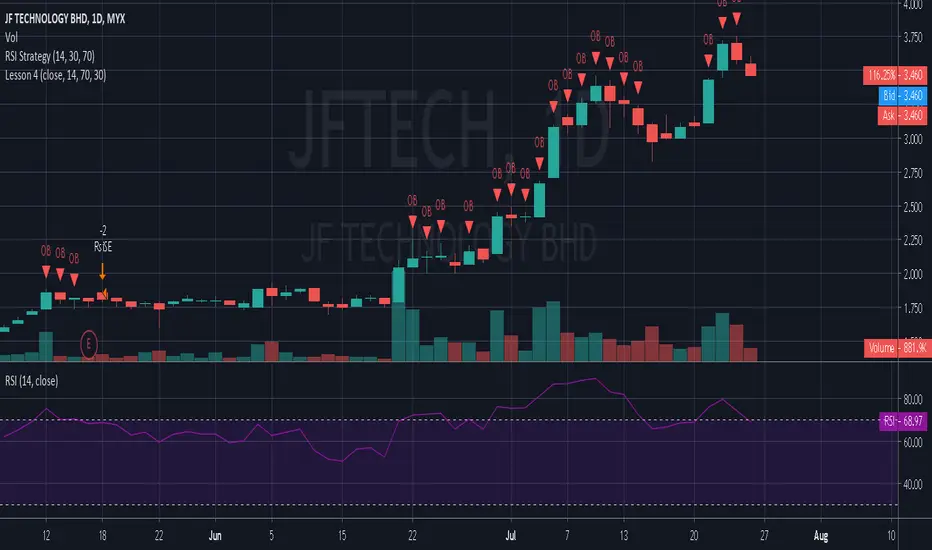
Time for cooling down and accelerate againJFTECH bonus issued recently, expecting 4x volume traded before bonus.
Expecting with lower volume coming days with sideway movement, RSI also showing the level of tendency of sideway movement.
Forecasting good/better coming Quarter report will tend to move up.
Orange hidden horizontal line is support/resistance.
Do position well, and TAYORA.

JFTECH All Time HighMy 1st trade into the Malaysian Market. As usual, all my charts look the same. Price has reached an All Time High. It is my favourite theme and only theme. It doesn't matter what market. Look at my other charts.


what is JFTECH next target price?JF Technology Berhad, which was incorporated on 29 April 1999, with the primary aim of servicing the manufacturing industry and also to handle trading of electronic products and components. It started off with its maiden product which was the Single Pin Cantilever Test Probe, and further continued into becoming an independent OEM manufacturer.
www.tradingview.com
next target Rm6.50
Before end of Jan ?

JFTECH- BREAKOUT FROM PENNANT WITH THE FIRM SUPPORT BASE.Breakout from pennant while supported on the very firm support !

JFTECH - BREAKOUT WITH HISTORICAL HIGHStrong breakout and now it is on the new historical high ! Momentum to continue

JFTECH - Pending Breakout JFTECH
Rst: 5.00
Spp: 4.80
Got its weaker formation being rejected today, meaning you can re-enter. For me, the stronger confirmation is when it breaks pennant formation (refer to chart).

JFtech (4HR) - ForecastPlease like and share if you agree with the analysis.
Hopefully it will be beneficial to any of you guys.

JFTECH - rallyin 2nd stage Note.
- New update soften Resistance line
- New update soften Support line.


Resistance AheadGood momentum found on JFTech, which has been in successful rally after the price plummeted on March. The share found resistance at Fibonacci 2.618 coincides Negative divergence found on MACD histogram on July and later successfully breached both flag and Symmetrical Triangle, hit Fibonacci level at 3.618. Our view is still bullish with both EMA10 and EMA50 still intact, however we found a negative divergence in MACD histogram on weekly timeframe. Hence, we put resistance 5.075 (Fibonacci 3.618) in focus. Significant close above this level signify continuation of the rally, however breaking the first uptrend fan line could be the a sign of Bearish move
Disclaimer the content on this analysis is subject to change at any time without notice, and is provided for the sole purpose of assisting traders to make independent investment decisions.

JFTECH - now in correctionNow it is in correction due to profit taking pressure.
Watch out if the confirmation level 4.50 is broken for further uptrend, else we will see at 4.00 support to enter.

JFTECH [27 October 2020] Buy On Dip in Support ZoneMYX:JFTECH
SWING: 2 DAYS TO 2 WEEKS
Breakout Downtrend Line
52 Weeks High Line
Fibbonaci Retracement
Candlestick Support & Resistant Zone
Trendline Support & Resistant

wil it drop to 4.3 Question you need to ask yourself :-
1) Is it UPTREND ? ema 20 > ema 50
2) Is it BULLISH ? price > ema 50
3) Is it STRONG BULL ? fift positive
If yes,
4) Where is your Support and Stop Loss ? 3.8
5) Where is your Entry Point ? wait til 4.3
6) What is the % risk (Stop Loss - Entry Point)/Entry Point 11%
7) Can you take this N% risk ? yes
8) you got a setup if yes.
9) TP1 5.2

Bullish Signal Shown in JFtechBreakout of rm4.09 ( cup and handle formation), likely to retest historical high in short term.


Descending Triangle with Sideways ETA 6 Oct 2020JFTECH has been trading above its upward sloping 20-Day Moving Average which is a good sign.
It is important to calculate the risk/reward as the recent upward movement has pushed the price to be quite far from the support level of 2.89.
Resistance 1 : 3.65 (3.74%)
Resistance 2 : 3.7
Support 1 : 2.89 (-17.81%)
Support 2 : 2.83
Descending Triangle prediction at 21 Aug 2020.
Possible bearish price movement towards the resistance 2.89 within the next 118 days (30 bars : ETA 6 Oct 2020).

JFTECH long trading planDisclaimer : This analysis is not meant for buy call, but personal trading idea log for reference.
Analysis is based on trendline and channel. Confirmation on our long position are based on RSI, Stoch, MACD and MCDX (indicator by @kgiap123).
JFTECH is in uptrend and this is confirms by the channels, trendline drawn based on LL, LH, HL and HH indication on chart. Retracement on 9 July 2020 is noted based on the HH indicator thus a down trenline is drawn and monitor if there is any breakout in daily chart. Today 21 July a breakout happened at daily chart. The uptrend may continue tomorrow, and if it breaks the HH resistance line, it may go higher. Based on fibonacci indicator for a long position trade can reach highest TP at RM4.50.
Confirmation of long position are based on:
- MACD crossing up forming.
- RSI > Stochastic
- MCDX that indicate smart money still high more than 50%.
