BAHVEST trade ideas


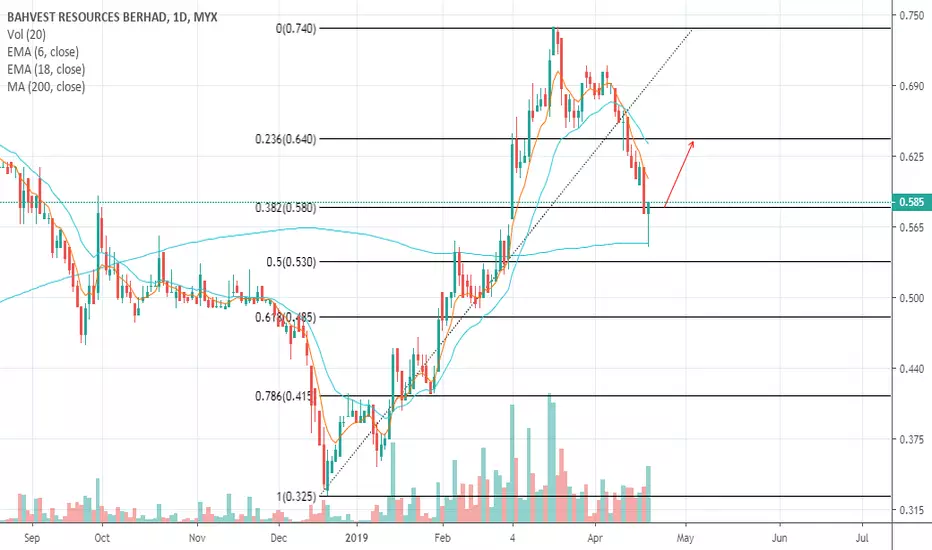
BAHVEST Bahvest has a strong support at the area of 0.630-0.635 on it's trend line and horizontal line. It closed slightly lower on Monday at 0.63 which quite close to the MA 20. May consider to enter if there is a strong green candle with strong volume on the next few trading day. Currently the volume is getting smaller. We might need a strong volume to push the price up. Once you have entered, you may consider to take profit at 0.71 which is the previous resistance; and cut loss at 0.595 at the previous support.
*Trade at your own risk*


WAITING FOR BAHVEST TO CLOSE EMA LINE 20180726
CODE:0098 (BAHVEST) BORNEO AQUA HARVEST BERHAD
CATEGORY: SHARIAH
CCI: STILL LOW. BELOW 0
MACD: HISTOGRAM MOVING UPWARDS
RSI: WAY BELOW 70
BOLLINGER BAND: HIT LOWER BAND YESTERDAY
EMA (15 DAYS): PRICE NEARLY CROSSES 15 DAYS EMA
MA(130 DAYS): ACT AS SUPPORT.
ACTION: WAIT FOR CONFIRMATION WHEN PRICE CLOSES ABOVE 15-DAYS EMA LINE AT RM1.315
STOP LOSS AT RM1.27
TAKE PROFIT WHEN RSI HIT 70
CAUTION: BOLLINGER BAND IS MOVING DOWNWARDS PATTERN
DISCLAIMER: Please note this is a personal opinion. I have not been paid by any company to promote their equity nor gain any benefits from it. It is advisable to trade based on your understanding of technical and fundamental analysis. All the best!


BAHVEST - Jumping Deeper Into The Red SeaLaburlah's Daily Complimentary (05-APR, Thursday):
BAHVEST
Technical Analysis Breakdown
1. Trend: Bearish/ support violated
2. RSI & Stochastic: Bearish
3. MACD: Bearish
4. Bollinger band: Widening
5. Selling pressure: Intensifying
Disclaimer: The abovementioned is purely for sharing purpose, you should seek advice from relevant personnel and do your own analysis before making your move.
