Implats Long This is what I see
Bull flag
Money flow going to the green
Momentum wave going up, potential anchor wave forming
Bullish divergence
What more do you want, are you not satisfied.
0S2J trade ideas

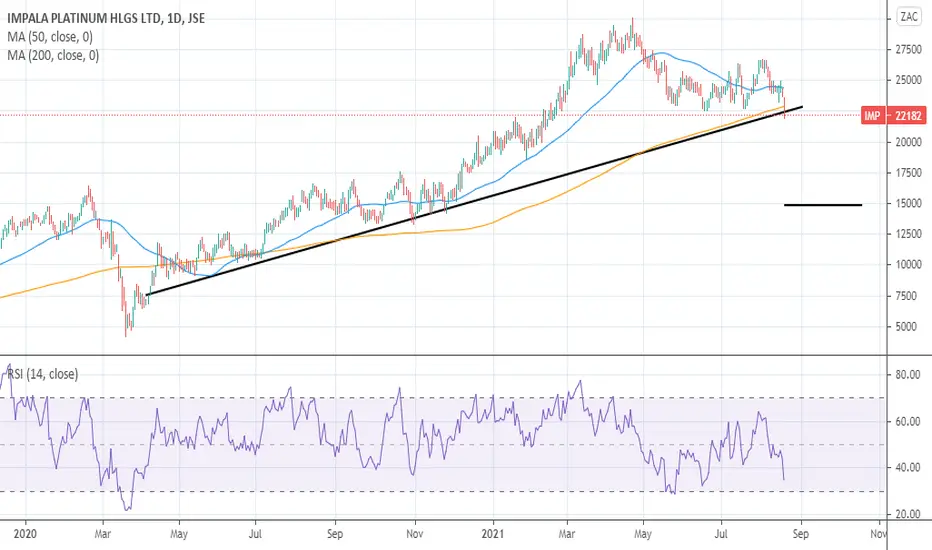
ImplatsImplats flirting with a year & half long trendline support on the daily chart; which is also coinciding with the 'last line of defense ( the 200dma).
A break here could take price to 150.
But until the trendline gives in, the trend is up!
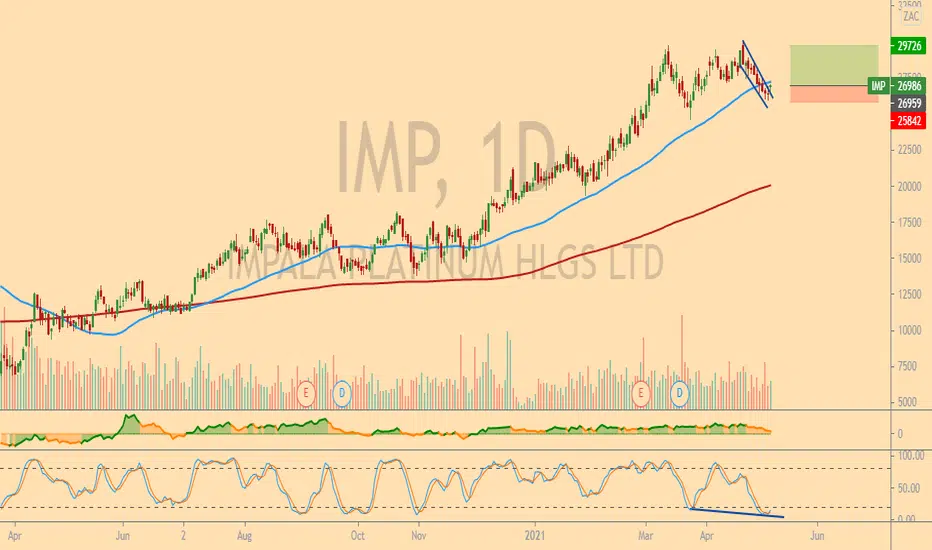
IMP breaks out of consolidation zoneSince mid-May, JSE:IMP has been struggling to make lower-lows and found itself in a sideways consolidation period. With yesterday's upward move, it has broken out of the top of the consolidation zone. If the momentum continues, we could see a move up towards the 30000 resistance level.


Impala platinummarket is in a strong bullish trend with no divergence on the MACD on the monthly,
Trend line was broken on the weekly that indicates a correction in the market before we see the next leg higher which could possibly be the last impulse move in the stock before entering into a bearish market cycle.|
Ill wait for the correction on monthly to play out s we already see on the weekly support being established at current market price, in the short term will see bullish price action and then a quick wave down towards 20000 and then going towards the 35000 at which ill get out of this market, this could be by early 2023 or late 2023 when the FED announces its taper stocks will then enter a bear market for the until the fed stopped hiking interest rates. Enjoy the last couple of years in a bullish stock market, rates are ging higher and stock prices will need to adjust

Long on Impala PIatinum (IMPUY) - Quick Play 15, 16-ish to 20!After Impala Platinum Holding Ltd. has been held down all of these years, its time for the company to return to where it belongs... way, way up.
While I would love to talk about returning to all-time-highs of 40++, why not just get in while the market is at a low around the next resistance point of 15 or 16, and then ride it to at least 20 for a casual 20-25% gain.
Financials are healthy, so why not ride these guys out!
Once you have your 20-25% gain locked in at 20, I would even reconsider doubling down and seeing how many resistances it can break as we keep going higher!
How long will it take... let's talk about it!


A Turn in the Platinum Miners? Part 1 - IMP JSE:IMP Given the weakness in the platinum miners and resource stocks in general in the last few weeks, it takes some bravery/optimism/fondness for punishment to start nibbling at long positions.
Some resource stocks, and platinum miners in particular, are tilting bullish. on JSE:IMP :
- Golden cross & bullish confirmation on 1D MACD
- Bullish divergence on weekly MACD
- On Weekly: Crossed 5EMA and heading towards 15EMA
- On Daily: Crossed 5EMA & 15EMA, and 5EMA is threatening 15EMA cross.
What do you think - bottom in? Looks like a reasonable risk reward trade if you keep your stops tight. I'm looking to enter at R246 with a stop at R239, target R271 ... 3.5:1
UC

Impala Platinum Head and ShouldersI reentely recommended Impala and a stop loss at a lower low. Well the trade has clearly ended and the chart has gotten bearish. Measured move is given in the chart.

Impala PlatinumI've started to review some trading opportunities for our clients going into next week. One of the setups is IMP, where a small bull flag may be developing.
As you can see, I retained the old annotations in 'white', with the price having pretty much given followed our prior price path since mid-April. Also note the two areas we previously highlighted:
Red: Provisional resistance area, Green: Best probability for next accumulation (also where the 200-day is now situated).
If the bull flag is triggered, it could be a nice ~1-week play (?) into the resistance area.
I'm monitoring this one and a few others.

Impala Platinum - BTFDChance to accumulate or swing to the top of the channel. Stop loss for me is a lower low so choose accordingly.

IMP bull flagIMP triggered a bull flag pattern. Stop will be a close below R260 and target between R290 & R300.
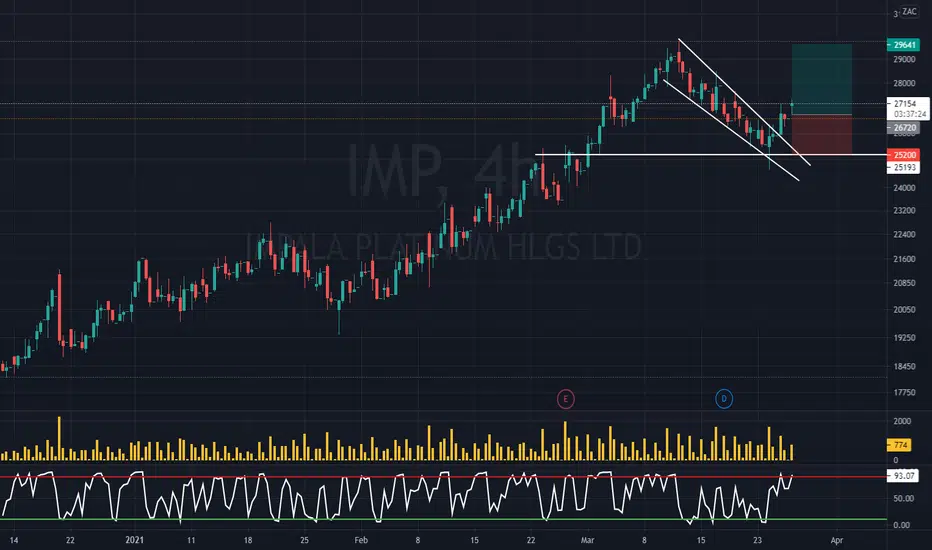
IMP "Accumulate Near Prior Congestion; Short Back-Test of Breakdown"
Over the last few weeks, we have highlighted the PGM sector as vulnerable to downside, with both IMP and AMS flagged as having the potential for downside risk. Last week we presented our perspective on IMP’s monthly chart risk while the previous the daily chart was flagged with the potential price path from mid-April following our expected trajectory (highlighted on chart), and now having breached two incline support levels.
On the buy/long side, we would look to accumulate (provisional) at the prior congestion zone, which is between 21300c and 21700c.
On the sell/short side, the next rebound into the 26500c to 27200c range is a provisional distribution zone.

IMP - Bull flagA close above R270 triggers the long idea with a target at R290 while a close below R260 is the stop loss.

IMP - 1D - CAUTION, TIME TO TAKE SOME PROFITThe instrument is nearing all time high zone, although stochastics daily are oversold i would wait and buy closer to the lower green zone which matches with the 200day ma. there are also a bunch of Bearish engulfing candles, which together with the weekly stochastic still overbought points to a further fall in this instrument. Will reconsider buying closer to the 200 day ma.

Impala Platinum - Long Term CautionOne of the shares I will be highlighting in the upcoming week's research note(s):
- Long Term Holders: Caution; Test of Prior Multi-Year Breakdown Level and Fibonacci extension.
- Reviewing the monthly chart, it’s important to note the share trading at it’s prior multi-year peak, with the currently pullback being in line with the same breakdown level of July 2008.
- This level also coincides with the 4.236 Fibonacci extension.
- Also note the bearish divergence as per the monthly chart.
- As noted in our prior research note dated 23/03 at R2115, it’s peer Anglo American Platinum traded at a multi-year peak, created an opportunity for long term holder to reduce their positions at attractive levels. As of Friday’s close AMS traded R345 lower to R1770.
- As they say: ‘Sell when you can, not when you’re forced to!’

Impala found support on the 50EMAThis JSE:IMP bounce on the 50EMA has the potential to be a 1:3 risk to reward swing trade.

Impala Platinum breakout of the ascending triangleImpala breakout from through the resistance that formed an ascending triangle pattern. I've added to my breakout trade. and have updated my initial stop loss to slightly above break even

IMP Long position On the daily there are clear HH AND HL and clearly indicating a uptrend .
From the Fib on those certain points marked check for a candle stick pattern on the lower time frame


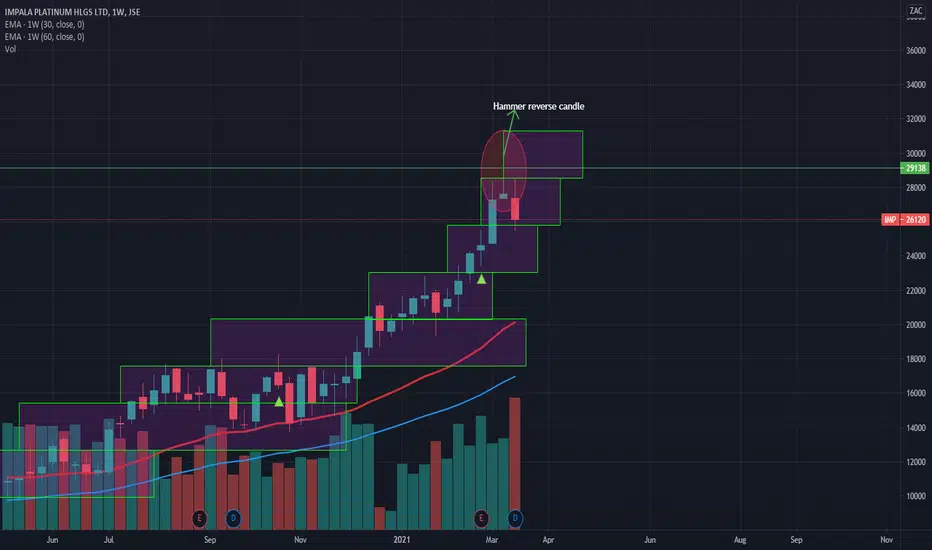
Worrying reversal candle, but I remain bullish on IMPThere’s a classic hammer reversal candle on the weekly chart. Which was subsequently followed by a bearish candle. This is a typically bearish signal. However, I still believe we in a bull market. If indeed The hammer trade proves right and the stock falls I will be stopped out at 23202c . As the stock moves to a lower box. But if that trade doesn’t play out and the stock moves higher. I will add to my position if we get a close above 29138c. This would be a multi year high close. The last time this stock closed higher than 29138c was in July 2008.
Trade Summary 22 March 2021
Average entry: 21962c
Position size: 16.4
Stop loss: 23202c
Risk: +20336c
Risk%: +2.44%
Dividends received 13120c.
IMP - 1D - CHAPTER 2Sentiments remain the same as idea published 11 Feb. Heavy overbought positions. Will wait for Fibonacci retracement levels before entering a trade.
