KRE vs TLTAre bond about to tank? KRE is threatening a range breakout just as bond pull into key support.
Could reverser quickly of course but something to watch.. Its been interesting to see bonds sell off as
the market sells off.
0L0X trade ideas

KRe/XLREQuite the move in the KRE/XLRE today....I plotted 10Y yield against it....Good proxy for interest rates (i.e. indicating headed higher).

Regional Banks On the Move!Regional banks have been an absolute dog as of late. They lag almost everything, other than energy. This sector has shown some strength since the “Tech Wreck”. So why do we focus on this group? Well it is part of a larger story…. interest rates. Let’s hop on the chart.
So here we have the charts of KRE. We have seen a downward sloping trendline that was intact for months break. Now we are going to test an area of overhead supply. If we break through at that area, that is bullish for stocks. If we break down at that level, we would be looking for a higher low to confirm the trend reversal. We are also seeing the RSI break through some overhead resistance which is bullish. We want to see participation from financials, even the small ones! Now this is also part of a larger story of interest rates. If KRE is rising, we can assume rates will rise as well. At least in the short term during reversals, these two trend together. We are seeing utilities break out too, which is another leading indicator of rates increasing.
Happy Trading!

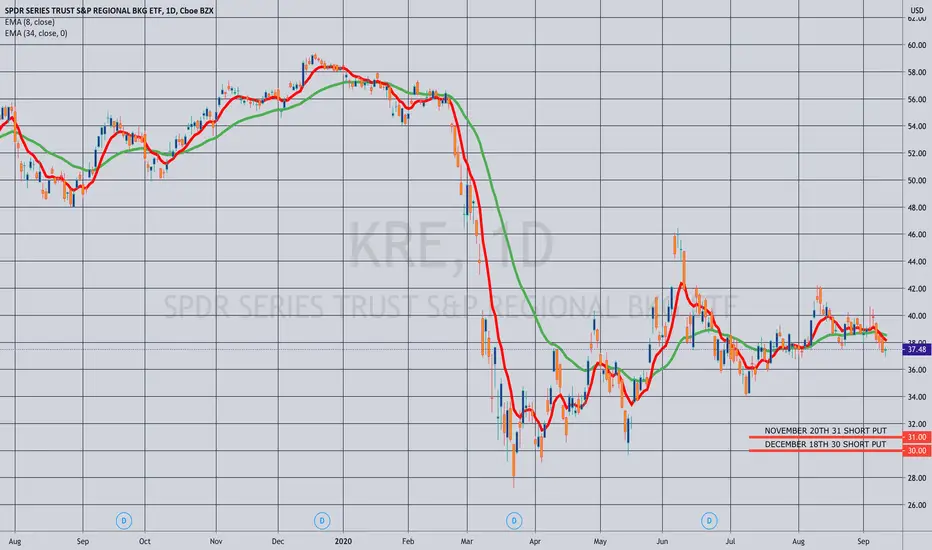
OPENING (IRA): KRE NOVEMBER/DECEMBER 31/30 SHORT PUT LADDER ... for a 1.49 credit.
Notes: With its current yield of 3.66%, looking to pick up some shares lower or just keep the premium. Background implied at 44.9% with an ROC of 2.50% at max as a function of notional risk, 9.71% annualized.

THE WEEK AHEAD: GDXJ, XOP, KRE, EWZ, QQQEARNINGS ANNOUNCEMENT VOLATILITY CONTRACTION PLAYS:
Currently, no options highly liquid underlyings announcing earnings next week with high rank/implied.
EXCHANGE-TRADED FUNDS SCREENED FOR 30-DAY IMPLIED > 35%:
GDXJ (16/54/12.0%)*
XOP (16/51/12.1%)
SLV (34/47/10.7%)
EWZ (17/45/10.7%)
GDX (18/43/10.2%)
BROAD MARKET:
QQQ (32/35/8.2%)
IWM (27/32/7.3%)
SPY (22/26/5.6%)
EFA (16/21/4.6%)
DIVIDEND-GENERATING EXCHANGE-TRADED FUNDS:
EWZ (17/45/10.7%)
SLV (34/47/10.7%)**
KRE (24/45/10.4%)
XLE (23/41/9.3%)
EWA (26/27/6.7%)
SPY (22/26/5.8%)
IYR (19/26/5.6%)
XLU (17/23/5.2%)
EFA (16/21/4.6%)
GLD (24/20/4.4%)
TLT (9/16/3.5%)
HYG (15/14/2.6%)
EMB (14/22/2.5%)
Pictured here is a two-rung short put ladder in KRE (Current Yield 3.70%) intended for a retirement account environment. It was paying 1.83 at the mid as of the Friday close, but it's bid 1.43/ask 2.18 in the off hours, so will have to price that out during the New York session. I've already got some EWZ on (See Post, below), but may consider adding some SLV for precious metal exposure in addition to my GLD due to its higher volatility and scalability (which I probably should have thought about before throwing a three lot GLD ladder out there) (See, GLD Post, below).
I've also added XLE to the list due to its current yield of 6.81%.
GENERAL THOUGHTS:
With the U.S. general elections occurring on Tuesday, November 3rd, I'll be looking to lighten up margin account positions running into the October monthly expiry (now 33 days 'til expiry). I will consider just flattening out completely, and then reestablishing positions thereafter. If you recall the last general election in 2016, it was limit down in /ES during the Asian session, all of which evaporated by New York open, leaving minimal volatility to take advantage of in its wake. I could see playing /ES in the overnight to capitalize on a potential volatility contraction that may occur in /ES from the overnight to the New York session, but it will depend to a certain extent on how much volatility expands running into the election.
I'll try to post a potential trade set-up, but I can say it's likely to take one of two forms: (a) an at-the-money long call vertical to take advantage of skew and with risk one to make one metrics; or (b) an out-of-the-money short put vertical -- both defined risk. I lean toward the credit side (short put vertical) due to having more room to be wrong, but will have to price things out in the moment to compare and contrast the two setups for buying power effect, profit potential, and probability of profit.
In the IRA, I'm going to keep on grinding on things as long as I can find decent premium to sell without going totally crazy; I want to keep a decent amount of buying power free in the event that we do get a big volatility event that shouldn't be passed up.
* -- The first number is the implied volatility rank (where 30-day implied is relative to where it's been over the past 52 weeks); the second, the 30-day implied volatility; and the third, the percentage of stock price the at-the-money short straddle is paying in the October monthly.
** -- Neither GLD nor SLV pay a dividend, but I have a GLD position on to give me some exposure to precious metals.

KRE in a tight narrow wedge - Must come downIt is stuck between 2 trend lines and there is no room to go. It has hit the top of the channel with lower volume. Time is ticking and i think we must go down.

KRE - Ran into Huge ResistanceRan into Huge resistance on the purple line. It happened in the past and it happened again today 8/12. I think it goes down $38 before we see what happens next.


KRE - Next Stop is the Support line. Will it go down from there?KRE has hit the top of its descending channel and is now approaching its support line. Lets see if it breaks through or bounces.

Regional Banks Weekly chartSitting in between 2018 highs and 2009 collapse lows. looking for a move to 29. The good ol consolidate the banking system may be under way.

Ugly Chart and Bad Fundies for BanksExpecting something like this to play out with KRE (regional banks). So many headwinds for banks going forward, even if we avoid any further Corona problems (big if), we are expected to be in a zero or negative rate environment for years to come. Just look at what happened to Japanese and European banks under those conditions for long timeframes. It's not pretty.
Plenty of room to the downside after breaking through the primary wedge support line. Next stop looks like $33 area. Would expect some sort of bounce there before resuming downtrend to test the march lows.
Position:
12/18/20 25p
Would reassess if genuine reflation and growth begins in the economy. Long duration on the option so even if next move in stocks is upwards I plan to diamond hands these.


Still KRE but another point of view Analysis Here is my update of the KRE chart.
I think we are heading back to the 32,67$ area and if we won't break the uptrend channel, from that point we will go up and will retest 37 and possibly 40 at the top of this daily support channel.
As you can see, we are still in the uptrend on the D chart. The RSI is on 46%, there is no volume fading, and the indicator shows almost exactly the same level in the last 3 days. Today We peaked the profit 1 level, and then the bulls weren't strong enough so we went back.
Let's dive into the 4HR and 1HR time-frames to see that where we are heading now and find some answers to our questions.
4hr:
Trend direction:
We are still in the Daily chart's uptrend channel.
Candles:
After a tremendous bullish engulfing, we have a hanging man candle formed, and the after-hours candle opened lower than the previous candle's close price.
Momentum indicators:
RSI turned back from 54,56% ( which is a strong resistance level)
Volume shows me less volume in the last candle.
SMA: Big distance between 10SMA and 20SMA
EMA: We are under the 50EMA
An interesting fact is that 50MA was 2 times is a support line for the price that means 32,67$ is a strong support before the major support 31$.
1hr:
We have a kind of bullish harami, which turned back from the 50MA support level, accidentally the 20SMA was at the same level.

Analysis of the KRE chartHere is my new idea but, before starting talking about technical Let's share your LOVE by giving me LIKES and COMMENTS. Thanks in advance.
the 1hr chart
On the RSI : 3 times tried to break the 57,27 level but seems like a strong resistance, and always went back to 54,10 ( strong support) level.
What signs show that we are in the uptrend:
- We have a Doji after a Bearish Engulfing.
- The 10 SMA crossed above the 20sma, pretty bullish and we are still over the 50EMA
- We still have a place to go upper to the 60,32 area of the RSI, where is another strong resistance.
------------------------------------------
Let's see the things on the 4hrs chart:
The 4hr candle closed out of the uptrend channel and we below the 50EMA
The 10SMA crossed 20SMA below those are not good at all
so there is a strong possibility for a pullback
-----------------------------
LEt's see the story on the D chart
We had a dead/death cross(3rd of March), because the shorter-term 50MA crosses below the longer-term 200MA,
We are still below the 50EMA and the 200EMA
-----------------------------
Monday will be exciting, hopefully, a short rally up for the profit 1 and then the pullback, and it can turn back to go and reach the profit 2

KRE will suffer a lot from rate cutsTake $TLT chart and flip it over. This is how KRE chart should look like...


KRE, update!AMEX:KRE
Price has come back into critical zone, trying to clear the resistance levels. Short term price momentum as indicated by red line is upwards. AS long as price above this line, stay long.
By joining various lows, I have formed the medium and long term support lines
Price has already created a support level near $48.87.
Important trading levels
R1 : $58.60
R2 : 65.77
S1 – 50.88
S2 : 45.16
S3 : 36.25
Please share a thumbs up if you like what you read!
Cheers

Path of least resistance is...lower?Yields are looking ready to resolve lower - global yields tell a different story though, specifically the German and Japanese 10Y Yield.
$TLT vs. $SPY also suggestive of Bond out-performance on the horizon

Bank ETF Pulls Back Before EarningsBanks ended 2019 on a strong note as gloom toward the economy lifted and investors started to appreciate their low valuations. Now a key exchange-traded fund has pulled back to a potentially important level: The SPDR Regional Bank ETF .
KRE is holding the same $57 area where it peaked in February and November. The 50-day simple moving average (SMA) has also risen up to the same area, producing a confluence zone.
Stochastics are also showing a potentially oversold condition.
Earnings season next week may provide some catalysts as well. The reports begin with big names like JPMorgan Chase , Citigroup and Wells Fargo on Tuesday, with smaller regional lenders following soon after.
The recent Iranian turmoil has hurt banks, however the broader backdrop could favor them: Economic growth continues to improve and the Fed is keeping short-term rates down. That could steepen the yield curve , one of the key ways that financials make money.
Value investors might also like the multiples on banks because KRE's price/earnings ratio is under 13x, according to ETFdb. Compare that to 23x on the QQQ (Nasdaq-100) or 20x for SPY (S&P 500).

KRE - time to go Long!AMEX:KRE
KRE, looks good to push higher! CMP : $57.28
We are witnessing a continuous higher high and higher low on the RSI indicator and price has just been pushed lower by the Resistance Line (R1) @ $58.60 levels
Price has already created a support level near $48.87.
Important trading levels
R1 : $58.60
R2 : 65.77
S1 – 50.88
S2 : 45.16
S3 : 36.25
RSI seems to be showing signs of being oversold faster at higher price points suggesting higher price action
Watch out for this space, go long and sit tight
Please share a thumbs up if you like what you read!
Cheers

$spy $kre If the market is going to keep going Kre will be nextLooks like consolidation before breakout. Headed to 61 and quickly
