APN trade ideas

$JSEAPN DAILYAspen has had a good rally from R64.50, but after hitting the GAP RESISTANCE it is now making some sideways consolidation and forming a Bull Flag which signals that more upside is possible

$JSEAPN Aspen Consolidating after a good runMaybe time to take some profit off the table on this one. Can always enter at a lower level or add again if we break higher.


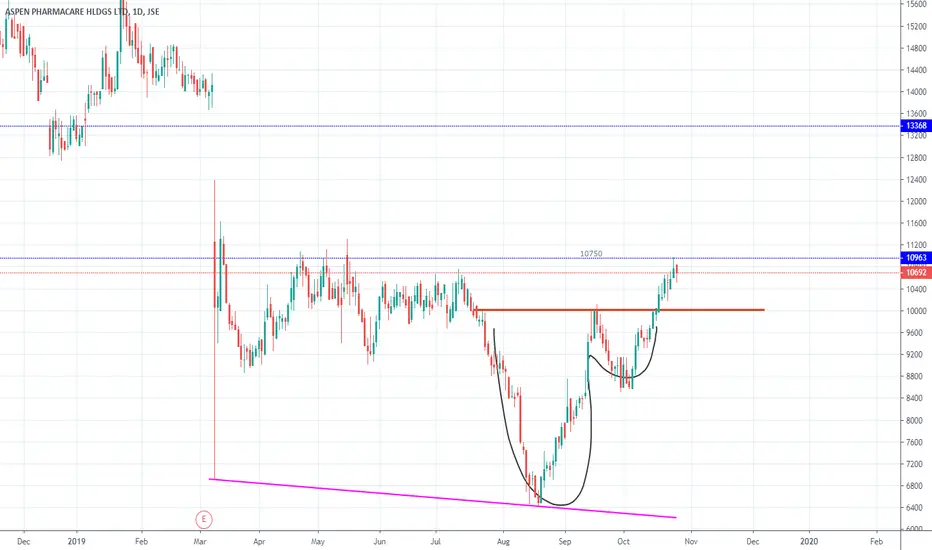
18 Oct 2019 - Aspen - JSE:APN - Long - Cup and Handle - MPTSince July 2019, it's been forming a Cup and Handle and finally has broken above.
Looks good for upside.

APN - RSI Signaling Pullback PotentialAPN 11884
- RSI losing trend line support in contrast to price remaining above TL support
- RSI breakdown is often 'early' signal of potential ST weakness (ahead)
- Candle Structure: A close below 11825 will form bearish engulfing candle
- Prior breakout zone (backtest): 11062

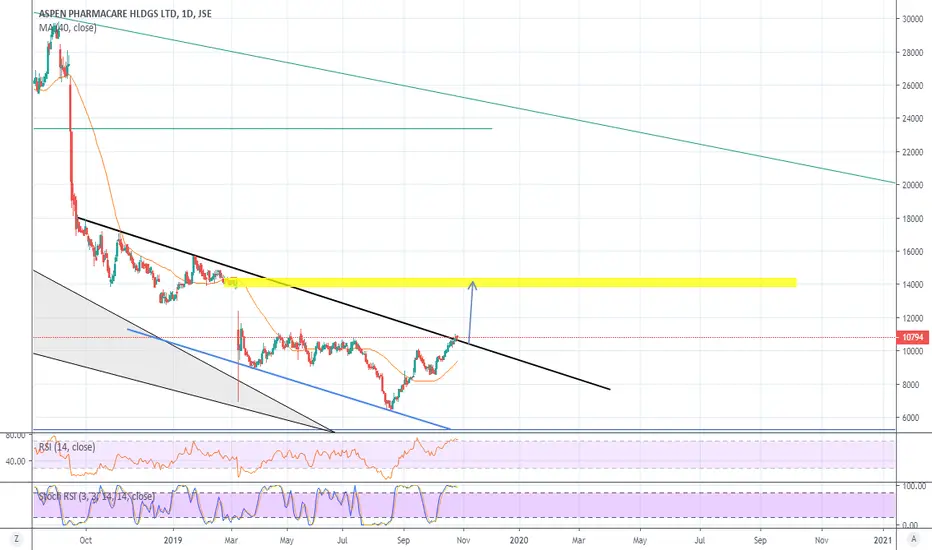
APN - Possible gap close coming upTraders don't like gaps in the price and there has been a large gap in JSE:APN since March this year.
The price ha finally reached the top of the candle that caused the gap, and if it confirms a break above the spike, I wouldn't be surprised if it goes all the way up and closes the gap. Let's wait and see what happens.

$JSEAPN - Gap to fill around R136Aspen has broken it short term downtrend and is now well on its way to close the gap. Disposal of its Japanese business should help to boost the stock.


$JSEAPN Aspen. Locking in some profitAfter a 30% ride, I'm locking in some profit. Waiting for a pullback. Think this one has more to give.
APN strong resistance or breakoutAPN possible resistance on weekly chart
expect accumulation or retracement set stop loss
or take profit
short or pull back a possibility

APN - Potential Bottom FormingWe may derive the following from the Weekly APN chart:
1. Price has respected the double bottom.
2. It is probable that price will test the resistance level first and come back down.
3. Monitor price action and wait for a long set up.
4. As always - maintain your risk.
Note: The views provided herein do not constitute financial advice.

APN possible turning pointJSE:APN has reached quite a significant resistance level which could mean a change in direction to the downside. I will keep an eye on this one to see if it breaks through the resistance and continues upwards. If so, I will enter long.
My outlook is bearish, however, and I anticipate that it will fail to break through and turn downwards for a short. As always, I will wait for confirmation before entering either way.

$JSEAPN Aspen Large cup and handle formation Very large cup and handle formation on Aspen. This is a bullish formation and if it breaks it will open targets much higher than originally anticipated. Current targets of 10750 & 11300 could then be extended to longer term targets of 12750 & 14000.

APN Long Continuation or BounceASP flat top Resistance triangle
current market condition leaning to possible breakout
or bounce with correction
wait for breakout
Also possible Double Top Forming

$JSE-APNJSE:APN
Broke higher from small consolidation area. More upside is likely.
Targets 10100,10700 and 11200 top of the big range.

APN Long PredictionAPN Close Above 9764 Will create a crossover of the MACD
indicating strong support for the next breakout run up
wait for cross or breakout


ASPEN upswingA bullish engulfing candle pattern formed on JSE:APN friday at a support level. This could mean an upswing is imminent. The stochastic has also recently made an upswing.

APN - Potential move higherWe may derive the following from the Daily APN chart:
1. Price has tested the daily resistance a few times.
2. We will need to wait and see what price does - a close above should push the price higher and fill the gap.
3. Monitor price action and be patient.
4. As always - maintain your risk.
Note: The views provided herein do not constitute financial advice.


$JSEAPN Aspen to face a fierce test against the 20 week maThe 20 week moving average (wma) has been been a tough nut to crack for Aspen since its rapid decline started back in September 2018. The 20 wma currently sits @ 93.89. If aspen can gain some traction above the 20 wma, see a close above R90.00 on the weekly (above the previous floor), one could see the stock gain some further traction with a first target at the 50wma (+-R118.00) currently. Encouraging is the fact that the RSI has pushed above the 40 resistance level which has also halted any previous advances in the share price.
