CTK2019 trade ideas

SELL CTThe price will be pushed back by the value area (BLUE ZONE) ; as soon as the big players get in, it will explose very high even above 77.04 !!!
be ready. pay attention to the volume.


CottonLack of volume to break-up the 50% Fibonacci retracement at $58.6 implies a high probability for prices to go lower.


CT1see that the cotton has reached the fibo level 0.5 but it could not have broken it.
So if the price breaks strongly with the 0.38 level there will be a probability of going for the 0.23 fibo level.
on the other hand if the price does not break the level 0.38 there will be a probability of visiting another time the level 0.5 or more.
if you liked this idea or have your opinion on it, write in the comments.

Cotton forcastingUsing pitchfork for me cotton can take to 57.35(increase). but we make attention because we are anti-trend. Next days can tell us everything about cotton. if you have any idea we can discuss.

Extra Cotton Anyone?I think cotton is going up. A steep run down then back up. I call that a V-shaped bottom...thats a good chart pattern to buy into. Have a good one guys.

COTTON: THE MOST INTERESTING COMMODITY AFTER GOLD RIGHT NOWHello traders,
I tried to look other than the crowded trades of these days (gold and oil) and I came up with cotton.
The price held very well the multiyear dynamic support. Also, COT signals that producers almost closed all their short, meaning that they think not to need an hedge against falling prices for the moment. That is a very bullish signal to me. It is a risk, but well rewarded.
C 65 June 20
cost 200usd
TP1 = 65
TP2 = 72 (3750payoff, meaning a 19x)
SL = 100usd on the option value


COTTON FUTURES (TT1!) DailyDates in the future with the greatest probability for a price high or price low.
The Djinn Predictive Indicators are simple mathematical equations. Once an equation is given to Siri the algorithm provides the future price swing date. Djinn Indicators work on all charts, for any asset category and in all time frames. Occasionally a Djinn Predictive Indicator will miss its prediction date by one candlestick. If multiple Djinn prediction dates are missed and are plowed through by same color Henikin Ashi candles the asset is being "reset". The "reset" is complete when Henikin Ashi candles are back in sync with Djinn price high or low prediction dates.
One way the Djinn Indicator is used to enter and exit trades:
For best results trade in the direction of the trend.
The Linear Regression channel is used to determine trend direction. The Linear Regression is set at 2 -2 30.
When a green Henikin Ashi candle intersects with the linear regression upper deviation line (green line) and both indicators intersect with a Djinn prediction date a sell is triggered.
When a red Henikin Ashi candle intersects with the linear regression lower deviation line (red line) and both indicators intersect with a Djinn prediction date a buy is triggered.
This trading strategy works on daily, weekly and Monthly Djinn Predictive charts.

COTTON FUTURES (TT1!) WeeklyDates in the future with the greatest probability for a price high or price low.
The Djinn Predictive Indicators are simple mathematical equations. Once an equation is given to Siri the algorithm provides the future price swing date. Djinn Indicators work on all charts, for any asset category and in all time frames. Occasionally a Djinn Predictive Indicator will miss its prediction date by one candlestick. If multiple Djinn prediction dates are missed and are plowed through by same color Henikin Ashi candles the asset is being "reset". The "reset" is complete when Henikin Ashi candles are back in sync with Djinn price high or low prediction dates.
One way the Djinn Indicator is used to enter and exit trades:
For best results trade in the direction of the trend.
The Linear Regression channel is used to determine trend direction. The Linear Regression is set at 2 -2 30.
When a green Henikin Ashi candle intersects with the linear regression upper deviation line (green line) and both indicators intersect with a Djinn prediction date a sell is triggered.
When a red Henikin Ashi candle intersects with the linear regression lower deviation line (red line) and both indicators intersect with a Djinn prediction date a buy is triggered.

COTTON FUTURES (TT1!) MonthlyDates in the future with the greatest probability for a price high or price low.
The Djinn Predictive Indicators are simple mathematical equations. Once an equation is given to Siri the algorithm provides the future price swing date. Djinn Indicators work on all charts, for any asset category and in all time frames. Occasionally a Djinn Predictive Indicator will miss its prediction date by one candlestick. If multiple Djinn prediction dates are missed and are plowed through by same color Henikin Ashi candles the asset is being "reset". The "reset" is complete when Henikin Ashi candles are back in sync with Djinn price high or low prediction dates.
One way the Djinn Indicator is used to enter and exit trades:
For best results trade in the direction of the trend.
The Linear Regression channel is used to determine trend direction. The Linear Regression is set at 2 -2 30.
When a green Henikin Ashi candle intersects with the linear regression upper deviation line (green line) and both indicators intersect with a Djinn prediction date a sell is triggered.
When a red Henikin Ashi candle intersects with the linear regression lower deviation line (red line) and both indicators intersect with a Djinn prediction date a buy is triggered.
This trading strategy works on daily, weekly and Monthly Djinn Predictive charts.


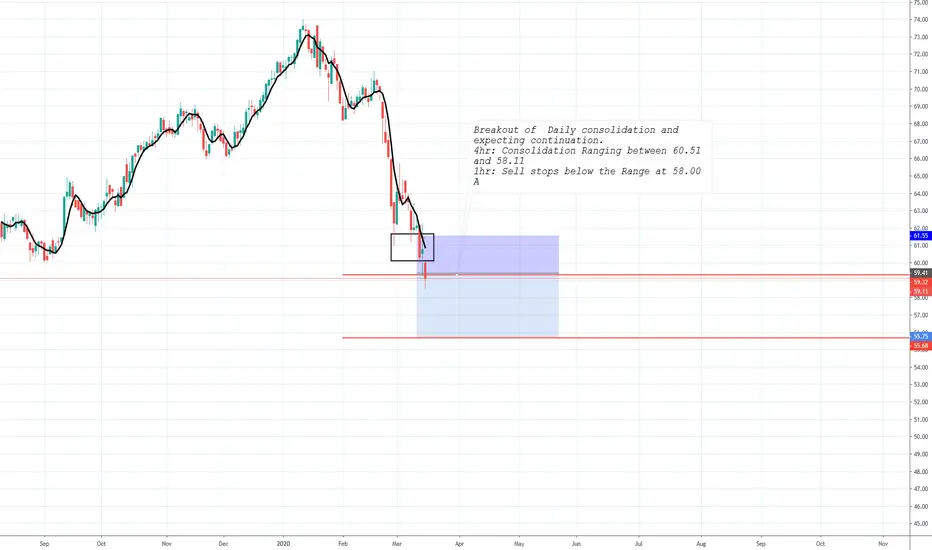
COTTONBreakout of Daily consolidation and expecting continuation.
4hr: Consolidation Ranging between 60.51 and 58.11
1hr: Sell stops below the Range at 58.00 A

Cotton--Pull back at key support. Long term BUYMy chart does not show the move lower today down to 63.00 . Great opportunity to buy cotton here


BITCOIN GOLD SILVER OIL GAS COTTON LBLS Indicator AnalysisThe chart of D time frame is taken for all of these analysis
And
LongBuyLongSell Indicator is used for the analysis
you can take a look at it here
Follow the chart given above for each of its stand.
If you like Share Like Follow
you can also get more details below scroll down.
TVC:GOLD
TVC:USOIL
BITSTAMP:BTCUSD


Cotton Futures Short setup starting to showCorrective 1h ascending channel PA into top reversal zone will tell me there is a high probability for a reversal to occur soon.
We could also see a blow off top through the zone followed by a bearish engulfing 4h/daily which will then see a short move start.
Medium term hold trade.
Depending on the entry candle a 70c stop would see profit targets of 5.7R to TP area 1 and 11.2R to TP area 2 and 15.3R to TP area 3
