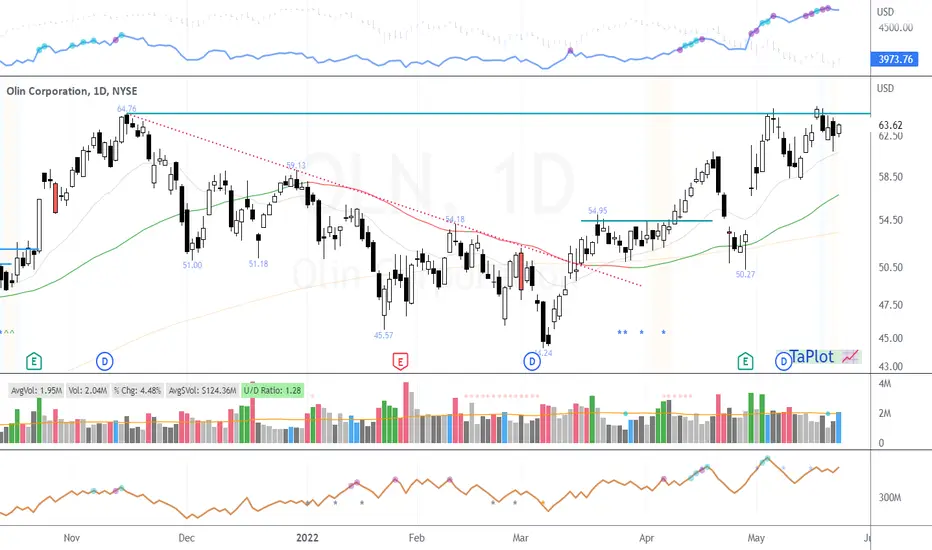
OLN is bullish nowOn the chart we can see the falling wedge pattern.
The price broke out of the wedge and it's reasonable to expect the continuation to the upside.
The price still may come back down to retest the downsloping resistance and backtest it in order to confirm it as a support which would be a perfect entr
Next report date
Report period
Q2 2024
EPS estimate
0.70EUR
Revenue estimate
1.60 BEUR
2.625EUR
416.95 MEUR
6.19 BEUR
118.88 M
About Olin Corporation
Sector
Industry
CEO
Kenneth T. Lane
Website
Headquarters
Clayton
Employees (FY)
7.33 K
Founded
1892
FIGI
BBG00SVFJH93
Olin Corp. engages in the manufacturing of chemicals products. It operates through the following segments: Chlor Alkali Products and Vinyls, Epoxy, and Winchester. The Chlor Alkali Products and Vinyls segment manufactures and sells chlorine and caustic soda, ethylene dichloride and vinyl chloride monomer, methyl chloride, methylene chloride, chloroform, carbon tetrachloride, perchloroethylene, trichloroethylene and vinylidene chloride, hydrochloric acid, hydrogen, bleach products and potassium hydroxide. The Epoxy segment produces and sells epoxy materials, which include allyl chloride, epichlorohydrin, liquid epoxy resins and downstream products such as converted epoxy resins and additives. The Winchester segment creates and sells sporting ammunition, reloading components, small caliber military ammunition and components, and industrial cartridges. The company was founded by Franklin W. Olin in 1892 and is headquartered in Clayton, MO.

OLN - head and shouldersHead and shoulders indicates a bearish pattern.
A good time to enter the short position would be once the price breaks the neckline.
Stop loss and target are shown on the chart.

$OLN Setting up around previous Nov 2021 HighsWatching to see what $OLN does here around the highs from back on Nov 2021. Big base.
Remember I posted about the low cheat back on 04/06
OLN channel breakAfter breaking out of a descending channel, price consolidated sideways and now is attempting to break and retest top of the channel.

13/4/2022 NYSE (OLN)Buy (Entry Price) within the buy zone area and exit (Stop Loss) below the red line. Can take profit at the suggested Target Price.
Entry Price: $56.49 / $55.41
Target Price: $57.60 / $56.25
Stop Loss: $54.57

Olin coporation nasdaq long possitionbullish indication
higher high higher low
green candle
crossed resistance level
following trend line and fib levels


4/4/2022 NYSE (OLN)Buy (Entry Price) above the black line and exit (Stop Loss) below the red line. Can take profit at the suggested Target Price.
Entry Price: $53.24
Target Price: $54.20
Stop Loss: $52.28

30/3/2022 NYSE (OLN)Buy (Entry Price) above the black line and exit (Stop Loss) below the red line. Can take profit at the suggested Target Price.
Entry Price: $52.74
Target Price: $53.75
Stop Loss: $50.91

Olin Corporation (OLN) LongWe can see global growing trend since March of 2020 on a different timeframes. Nearest support zone is $51.3 - $52.01. Target poins are $57.23 (upside ~4.5%) ana $62.4 (upside ~ 14.5%). Open price is current market.

See all ideas
Trade directly on the supercharts through our supported, fully-verified and user-reviewed brokers.


Frequently Asked Questions
The current price of OLN is 47.825 EUR — it has decreased by 3.65% in the past 24 hours. Watch OLIN CORP. DL 1 stock price performance more closely on the chart.
Depending on the exchange, the stock ticker may vary. For instance, on FWB exchange OLIN CORP. DL 1 stocks are traded under the ticker OLN.
OLIN CORP. DL 1 is going to release the next earnings report on Jul 25, 2024. Keep track of upcoming events with our Earnings Calendar.
OLN stock is 3.78% volatile and has beta coefficient of 0.99. Track OLIN CORP. DL 1 stock price on the chart and check out the list of the most volatile stocks — is OLIN CORP. DL 1 there?
OLN earnings for the last quarter are 0.26 EUR per share, whereas the estimation was 0.18 EUR resulting in a 39.51% surprise. The estimated earnings for the next quarter are 0.35 EUR per share. See more details about OLIN CORP. DL 1 earnings.
OLIN CORP. DL 1 revenue for the last quarter amounts to 1.46 B EUR despite the estimated figure of 1.37 B EUR. In the next quarter revenue is expected to reach 1.53 B EUR.
Yes, you can track OLIN CORP. DL 1 financials in yearly and quarterly reports right on TradingView.
OLN stock has fallen by 1.82% compared to the previous week, the month change is a 12.76% fall, over the last year OLIN CORP. DL 1 has showed a 1.73% decrease.
OLN net income for the last quarter is 45.04 M EUR, while the quarter before that showed 47.93 M EUR of net income which accounts for −6.02% change. Track more OLIN CORP. DL 1 financial stats to get the full picture.
Today OLIN CORP. DL 1 has the market capitalization of 5.80 B, it has decreased by 1.06% over the last week.
Yes, OLN dividends are paid quarterly. The last dividend per share was 0.18 EUR. As of today, Dividend Yield (TTM)% is 1.54%. Tracking OLIN CORP. DL 1 dividends might help you take more informed decisions.
OLIN CORP. DL 1 dividend yield was 1.48% in 2023, and payout ratio reached 22.39%. The year before the numbers were 1.51% and 8.95% correspondingly. See high-dividend stocks and find more opportunities for your portfolio.
Like other stocks, OLN shares are traded on stock exchanges, e.g. Nasdaq, Nyse, Euronext, and the easiest way to buy them is through an online stock broker. To do this, you need to open an account and follow a broker's procedures, then start trading. You can trade OLIN CORP. DL 1 stock right from TradingView charts — choose your broker and connect to your account.
As of May 2, 2024, the company has 7.33 K employees. See our rating of the largest employees — is OLIN CORP. DL 1 on this list?
Investing in stocks requires a comprehensive research: you should carefully study all the available data, e.g. company's financials, related news, and its technical analysis. So OLIN CORP. DL 1 technincal analysis shows the strong sell today, and its 1 week rating is sell. Since market conditions are prone to changes, it's worth looking a bit further into the future — according to the 1 month rating OLIN CORP. DL 1 stock shows the neutral signal. See more of OLIN CORP. DL 1 technicals for a more comprehensive analysis.
If you're still not sure, try looking for inspiration in our curated watchlists.
If you're still not sure, try looking for inspiration in our curated watchlists.
We've gathered analysts' opinions on OLIN CORP. DL 1 future price: according to them, OLN price has a max estimate of 69.96 EUR and a min estimate of 38.24 EUR. Watch OLN chart and read a more detailed OLIN CORP. DL 1 stock forecast: see what analysts think of OLIN CORP. DL 1 and suggest that you do with its stocks.
EBITDA measures a company's operating performance, its growth signifies an improvement in the efficiency of a company. OLIN CORP. DL 1 EBITDA is 1.02 B EUR, and current EBITDA margin is 20.69%. See more stats in OLIN CORP. DL 1 financial statements.