DOCK, FULL OF POWER !!!Dock has a very strong resistance and we have to see if it can break or not. But I believe that breaking for Dock is not so difficult. Because we have got several upcoming special events that you can check them out:
coinmarketcal.com
DOCKUSDT trade ideas

dockusdtdockusdt is forming a bullish cup and handle.when it breaks the neckline it would be good buy there.after breaking neckline .
NFA DYOR

DOCK / TETHERUSTriangle hacked and tested
She has a strong project
The numbers are good and they're about to pump
The goals are shown in the diagram


DOCK/USDT Double breakout done on The 1D timeframeDOCKUSDT Double breakout done on the 1D timeframe a buy now and hold for 😊🚀

Thoughts About DOCK Token$DOCK is building a type of solution where artist institutions and others can manage their verifiable digital credentials within a single ecosystem it is currently undervalued and we can see good upside from it in the future. Technically it is retesting support on the 1D timeframe and forming a cup and handle on 4H timeframe also having tons of news ahead so now is the right time to build your position in it for a handsome profit before DOCK pump hard.
-----
Good Luck 💰
-----
ISMASHPROFIT 💎

DOCKUSDT - Target 0.142++ Check Yellow Price Tag in the chaartDockUSDT headed for 4th wave down and following the white path to 5th wave up seems to be a reasonable bet in the short term, but this should happen before 26th August.
This is Price Action and Elliott Wave combined, I do not like Elliott Wave Theory much, but it is a strong concept and needs attention in every trade, but at the same time price action is a must tool to use in all your trades.
Let's see how this unfolds,
Thanks for following me.


Dock DOCKUSDT - Inverse Head and shoulders pattern!- On the chart we can spot and inverse head and shoulders pattern, which is very bullish (continuation pattern)!
- The price is currently breaking out of the Head and Shoulders pattern!
- Target is top of the trendline or 1.618 FIB
- For expected duration of the trade, probability, stop loss, profit target, entry price and risk to reward ratio (RRR) - please check my signature below ↓
- If you want to see more of these ideas, hit "Like" & "Follow"!

DOCK/USDTDOCK/USDT
Preliminary Entrance: .0972 on 8/19
Gains Accumulated Since Entry: 3.81%
Prognosis: Possible retrace & retest along 1.0 Fibonacci and the 0.5% level which precedes it (.094).
Do you like big wins and big money? Do you have strong hands and patience?
I'm a full-time Wyckoff VSA crypto swing trader (since 2017) and I regularly seek out the most lucrative swings available on the major exchanges.
All my charts are clean, straightforward, and easy to follow. No junk, no needless indicators, just solid volume spread analysis and simple 'take-the-money-and-run' Fibonacci target zones.
I review over 250 coins & tokens daily and handpick my break-outs and runners (no bot signals).
My win rates are between 80-85%. Follow me on TradingView and see for yourself.
** Not financial advice. Please trade at your own risk.

Dock DOCKUSDT - Head and shoulders +500% gains!- Dock Rank #442, Volume 24h $51,212,530.
- The price is above the 200 moving average.
- On the chart we can spot and inverse head and shoulders pattern, which is very bullish (continuation pattern)!
- Target is top of the trendline or 1.618 FIB
- For expected duration of the trade, probability, stop loss, profit target, entry price and risk to reward ratio (RRR) - please check my signature below ↓
- If you want to see more of these ideas, hit "Like" & "Follow"!

#DOCKUSDTCrossing the Moving 200 in daily timeframe. And the exit of the price from the downtrend causes the price to continue up to the marked yellow lines


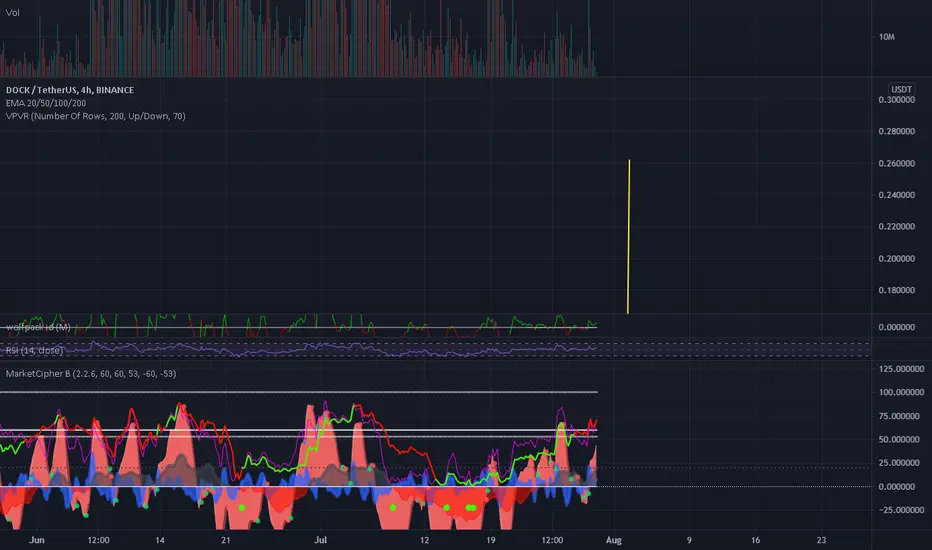
DOCK/USDT Setup - Large Macro Triangle This DOCK setup is unique from all the others, the pattern looks different. This macro triangle would land us all the way up around $0.26 if it plays out - that's more than a 4x from where we stand right now. Lots of potential on this one. The structure looks bullish with this rounded bottom forming right near the apex of the triangle and if this takes off and breaks out to the upside it's going to continue on a crazy run. I'm buying the bottom of this rounded bottom


2 idea for DOCKUSDTDOCKUSDT , 2 idea that most posible, we are in the end of triangle and 4 wave or we have another X and then a triangle , but in both idea we are in a good position for buy

DOCK/USDTaccording to the daily TP the price collides with sma 200 and is at the supported line . my analysis is that we can make a purchase and put the target 0.0958 in the resistance line.


#DOCK hit the dynamic resistance and ready to pump more than 50%DOCKUSDT
DOCK hit the dynamic resistance and ready to pump more than 50% after correction to the support

🆓Dock (DOCK) June-29 #DOCK $DOCKDOCK is increasing very strongly and its target in July is $ 0.1 area. So we will accumulate DOCK in the areas of $0.06 and $0.07 because it is quite safe.
📈BUY
🔴Buy : 0.068-0.072$
🔴Buy : 0.0585-0.0615$. SL if B
📉SELL
🔴Sell : 0.083-0.087$. SL if A
🔴Sell : 0.0975-0.1025$. SL if A
♻️BACK-UP
🔵Sell : 0.0585-0.0615$ if B. SL if A
🔵Buy : 0.049-0.051$ if A. SL if B
❓Details
🕯Timeframe : 1 Day
📈Red Arrow : Main Direction as BUY and SELL section
📉Blue Arrow : Back-Up Direction as BACK-UP section
🟩Green zone : Support zone as BUY section
🟥Red zone : Resistance zone as SELL section
🅰️A : The Close price of candlestick is Above the zone
🅱️B : The Close price of candlestick is Below the zone


Trading is a (winning) mindset Hi Folks,
I am in the middle of reading the book ' Trading in the zone' by Mark Douglas and I strongly recommend it reading when you are serious about trading.
He teaches u that trading is extremely psychology attached. My tip; Go read. you can find it for free on the internet at a pdf drive.
Now coming back to Dock/Usdt.
I always recommend when starting ' reading' a chart is to make a helicopter view before getting in to details.
1. What is your setup
2. What is your point of focus
3. Start reading the week chart and then the daily chart to end of with the 4 hour chart (my strategy)
4. Scroll of 5 times a chart so the timeframe gets wider to get a better look at the bigger picture.
5. Where are the resistance and support levels?
6. Do you recognize any patterns?
7. How about the volume?
8. How about the bars themselves?
9. How often do support and resistance levels get tested?
10. Do you see any bull or bear traps?
These are all questions I ask myself while opening a chart.
For me Technical Analysis is about confirming one signal with another to make it one 'thrustworty' signal. Of course there is a good possibility that the asset price moves in to another direction. That's ok. It's about your sample seize that matters not that particular trade!
For Me Dock/USDT is one I keep my eye on. The price is around support level and when it ' breaks' under and it comes in the zone I start buying. I put my exit point beneath the ANCHOR point of the most recent High to take my profit.
My strategy is to make a ' Quick' 30% profit. This is what a Trader/Hustler does.
So which side do you pick?
Are you a Hustler or a Investor?
