Zig ZagZig Zag almost complete. The abc zig zag consists of 12345 that makes up A (Impulsive) and Abc that makes up B (Correction) and 12345 that makes up C (Impulsive).
DJT trade ideas

BEAR IS ON $DJTTransportation index is a leading indicator of the general economy. it too ha also broke swing bottom. Just take a look at all the transportation stocks, majority of them are on a downtrend.
Bad time to come

Repeat of Covid Collapse?Bear Market? I'm just publishing this idea in case the market does drop and I can say I saw something. Maybe something will happen in the next 14-21 days (until 10/4 I think I marked on the chart)
These are just thoughts, nothing to take seriously...
Evergrande Not paying interest payments
- Potentially cause a ripple effect due to the large amount of US companies that are invested in China causing larger damage than expect?
- China pissing their pants and having the USA slip in the puddle
Increasing protests over Covid Vaccines
AMC MOASS
GME MOASS
Usual Mid September - October Bearish month
TLT Bullish Pennant as well, looking to break above 152.
What else am I watching?
TNX - 1/23/2020 bearish candle and break down people leaving
GOLD 2/13/2020 large moves up (money moving TO gold)
TLT 2/13/2020 startes to move up (money moving to TLT)
US10Y 2/18/2020 (started dropping)
JNK - Dropped same day as SPY (covid collapse 2/20/2020)
TLT/JNK chart - when this chart spikes like it did between 1/22/2020 on ward it shows big money ditching JNK to go to TLT (safe haven)
DXY - Strong dollar, weak stock market
Hedges?
TLT
Uranium (SRUUF/UUUU/URNM)
Cash
Or this could be a consolidation of sorts sideways.

TRANS - Trannies struggling in Trade WarsWith Containers hitting $35K for Transportation, an all time high...
Index of Global Real Economic Activity plunging...
All is well, move along.
Building a Container home?
Better buy a sailboat, it moves.
WEI has been cut on ONE HALF since April...
What is WEI ya say?
Weekly Economic Index - cut in half nearly in 4 months.
All is well... Move along.
GANN's 90 year Cycle, I believe, ends in March of 2022...
Ricky times ahead.

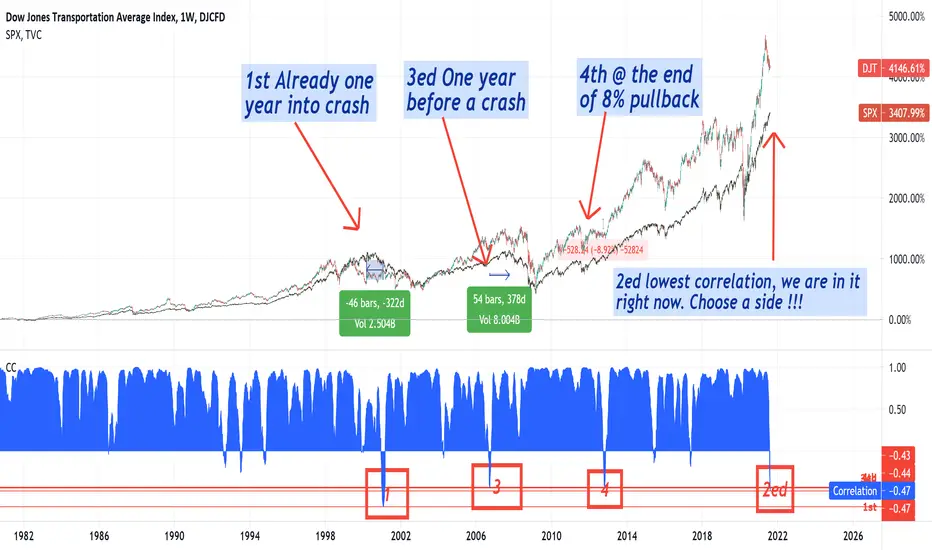
SPX since 1970, 2ed lowest correlation with Dow transportation! Nothing to add to the chart here, we are into the 2ed lowest correlation between Don transportation and SPX since 170
S&P500 Leading Indicator ScanRetracement clearly over, and now 5 out of 7 of my panel of leading indicators are suggesting that more crazy upside on the S&P500 is on the way. Only the High Yield Bonds and the Russell2000 have not taken off - yet.
On the contrary, we can visibly tell that the S&P500 is being stretched. It obviously is.
Nonetheless, expecting further gravity defying up spikes, at least for the next two weeks or so ... tread carefully!

DJT on a downtrend DJT is on a downtrend since i last posted on it last month. Of not all stocks in DJT are on a downtrend but the major ones are underperforming.
DJT touched on the MA100 line back in Jan 2021 and rose to ATH in May 2021. Since then it has declined around 13%. It is a lower high and low on the weekly and this indicates and confirms the downtrend unless this is broken.
UPS recently gapped down 3 days ago and has been going sideways (inside bars).
The transportation index is the driver of the economy and you need it to transport goods around. Perhaps the economy is slowing down a bit before moving higher. But with so many things are at ATH at the moment and very high valuations on few stocks, there could be a general corrections on the way, but might not be for a couple more months.
If the supply of credit is there by the Feds, this market will hold.

DJT ALERT!!!Dow jones transport still have plenty of room to the downside. While DJI continue to hold near the highs. Expect a big drop if the major index decide to follow the transport chart.

I moved to a net long at 90% in RAILSThe wave structure and cycle which was due to make a low due now has come in we will now see a new up leg and it will be lead by DOW TRANS But a warning if the djt only rallies back to a 50 to 618of this drop the last 5 weeks then a major CRASH will beset as I think into oct 10/20 .ALSO on oct 11 I will not be posting for about 6 weeks major reconstruction of my left shoulder and recovery. BEST OF TRADES WAVETIMER

𝗧𝗿𝗮𝗻𝘀𝗽𝗼𝗿𝘁𝘀 𝗨𝗽𝗱𝗮𝘁𝗲: $DJT Daily. 🐂-ish DivergenceBullish divergence at bottom of channel. Possible run to start on false #DeltaVariant fears?
$TRAN $IYT $JETS $AAL $UAL $DAL $LUV $FDX $EXPE $BA $SPY $ES_F $VIX $DIA $DJI #Stocks #Transports 🛫

Things may get uglyThe Transportation index generally is a leading indicator of the economy as you need logistics to move things around especially nowadays with online delivery.
The Dow Transportation index has fallen below the support level of 15317 and on June 10 when SPX hits all time high, the Dow index dropped and closed on the bottom. This generally is a bearish sign as the DOW is better represented of the US economy. Dow composed of major stocks from all industries except Utilities and Transport.
The Dow Jones index is weighted by the prices of stocks. SPX is weighted by the market value.
I guess time will tell

Not Slowing DownThe DJ Transportation Index is a leading indicator of the general stock market trend. It doesn't look like it's slowing down so for the moment, it's all bullish for the US market.

Transport IMPORTANCEMr Dow Jones said the real metric was the transport services. Well, here you go (off rails, spinning wheels, no paddle, crash landing, etc.).

Potential top in DJTWe might be close to a potential topping formation in the Dow Jones Transportation Index. I view this Index as a leading indicator for equities. Connecting the trendline from April '09 to the bottom last year, and projecting this trendline on previous tops and extending it, we have come close to the top of it right now. A potential scenario i'm eyeballing is where the DJI (Dow Jones Industrial) makes a higher high, but the DJT fails to make a higher high ( a divergence, see this chart ). There have been several in the past where we have seen market corrections shortly after.

DJT Dow Jones Transportations Under valued by 5%Dow Jones Transportations
Under valued by 5%
The index is under valued by 5-10 % , so we expect a strong move up
Good investment for Med to long term investors
like and share , kindly

DJTDow Jones Transportation Average | Month-on-month, the trend has been higher with higher lows culminating in a rising wedge combined with negative divergence on the 7 and 14-Day RSI. We do however know that the upside breaks of rising wedges lead to trend continuations. A break above 12900 opens up a bullish break while a print below 12200 would see a bearish structure being triggered.

DJT - Elliottwave analysis - possible correction time DJT - The transportation index seems completed impulse cycle from major bottom and should correct down. It is a sell set up with invalidation level above 12636.55 for abc down cycle. The overall correction should go down up to the level around 4th wave low near 11200 or even lower. There is always a possibility of further 5th wave extension, so if price break above 12636.60 then it may go higher.
Give thumbs up if you really like the trade idea.

DJT - Elliottwave analysis - possible correction timeDJT - In 4 hr time frame, it looks like the impulse cycle has been finished unless, the 5th wave will extend further. If considering the impulse over, then there will be big correction expected down below 10913 at least. The commmon cycle between both options, is simple flat like abc correction as shown on the chart, which might go for minor new high and then expected to be reversed for C down.
Give thumbs up if you really like the trade idea.


DJ Transport (Dow Theory) says GGGood Game... the DJ Transportation Index has broken down the up trend line. Sell signal on the ATIS system should be out soon. And MACD is crossing down into the bear territory. The BMT had already given way in early October.
According to the Dow Theory, the DJ Transports is a leading indicator and well, expect the rest of the market indices to follow.

𝗧𝗿𝗮𝗻𝘀𝗽𝗼𝗿𝘁𝘀 𝗨𝗽𝗱𝗮𝘁𝗲: $DJT Weekly. False Breakout?Got the new highs, but a false breakout? If so, should revisit $10K or lower soon
$TRAN $IYT $FDX $AAL $UAL $DAL $LUV $EXPE $SPY $SPX $ES_F $VIX $DIA $DJI $YM_F #Stocks #Transports 🛫

DJCFD (DJ Transportation Average index).Macro BullishHi,
Some say that the DJCFD is a good indicator for the general stock market, eg SP500.
If DJCFD does well, the others will do well.
This past week, as per the weekly chart, we can see a solid bullish candle close above a main resistance.
Before its retests this resistance level, I am leaning towards it reaching to the upper part of this regression channel first.
OBSERVATIONS\THOUGHTS:
====================================================
> MACD shows convergence on the daily and the weekly chart.
> Using both the channel and the fib tool, the next target level has confluence with both of these elements.
> Chart below shows top resistance trend line with confluence to this target area.
> Hopefully this also gives the SP500 and BTC the spring it needs for the bull trend to continue, once again.
NOTE: DXY finished bearish last week, which gives extra weight to this thesis.
Please give me a like or tick for this post.
Regards,
S.SAri
NOTE the top resistance trend line has confluence on my target as well
