Silver Quarterly 27$ WallIf you are wondering why #Silver is freezing up...
All you need to do is look at its quarterly chart.
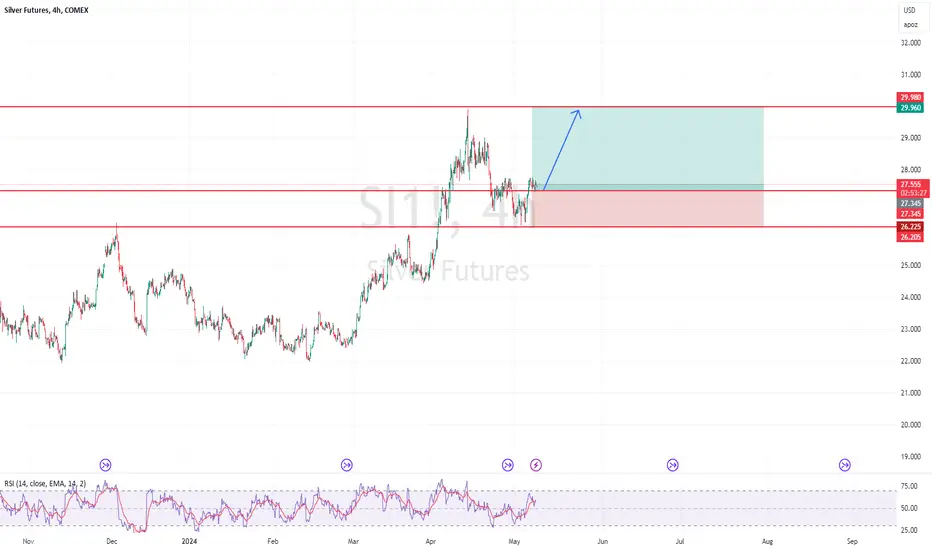
I can't over emphasize the importance of the wall at 27$.
11 times it was denied, making it a critical level.
Bullish momentum is putting upwards pressure on it.
About Silver Futures
Silver Prices have been followed for centuries. Silver is a precious metal used in jewelry, silverware, electronics, and currency. Silver prices are widely followed in financial markets around the world. Silver has been traded for thousands of years and was once used for currency backing. Silver continues to be one of the most commonly traded commodities today. Silver prices are highly volatile due to speculation and supply and demand.


Silver Futures Under Pressure Yet Targets Remain Intact Today'sToday's silver futures are experiencing some pressure, reflecting a challenging day for the precious metal.
Yesterday, there were outflows in the portfolio on June 25 from strikes of 32.5/35. Outflows of funds from the portfolio are partial and did not lead to the liquidation of the portfolio, whi

Bearish setupI revisited silver futures lately and noticed a double three wave pattern unfolding since Sept 2021 as the 'B' wave. We can break down this 'B' corrective wave as a W-X-Y wave, with W as a flat, X as a contracting triangle and Y as a single zigzag.
I believe this B corrective wave for silver is com

Silver MCX May Future Technical Chart Analysis 29 April These levels offer guidance for traders interested in trading Silver MCX Futures in May, providing specific entry points, target prices, and stop-loss levels to manage risk.
Range Point: 80,680
Day Range: 958 points
Buy Above: 81,034
Average At: 80,921
Buy Target 1: 81,272
Buy Target 2: 81,638
Buy

silversilver on multiyear breakout, it has succesfully crossed 800000 level , tetested and now up again for 120000 target. chart is making inverse head and shoulder pattern

Getting Caught in the Forest - Gold & SilverGold (June) / Silver (July)
Gold, yesterday’s close: Settled at 2331.2, up 22.6
Silver, yesterday’s close: Settled at 27.614, up 0.924
It is easy to get stuck in the forest and miss the trees. This is especially true when a trend turns violent. In such a pullback as sharp as we have seen across

#silver mcx symmetrical triangle forming After todays gap down opening
market is trying to form a symmetrical triangle
looking for a short entry

Dive into the world of options with our latest Silver analysis!In the next two options, with expiration dates on May 28 and June 25, bullish sentiment appeared on silver. Starting on April 19, the participant collected bullish spreads with construction sites 31/31.5 and 32.5/35 in his portfolio.
Based on the delta values of these strikes, these spreads can be c

See all ideas
A representation of what an asset is worth today and what the market thinks it will be worth in the future.
Trade directly on the supercharts through our supported, fully-verified and user-reviewed brokers.


Related symbols
Frequently Asked Questions
Buying or selling futures contracts depends on many factors: season, underlying commodity, your own trading strategy. So mostly it's up to you, but if you look for some certain calculations to take into account, you can study technical analysis for Silver Futures. Today its technical rating is strong buy, but remember that market conditions change all the time, so it's always crucial to do your own research. See more of Silver Futures technicals for a more comprehensive analysis.
The current price of Silver Futures is 28.505 USD — it has risen 0.50% in the past 24 hours. Watch Silver Futures price in more detail on the chart.
The volume of Silver Futures is 76.26 K. Track more important stats on the Silver Futures chart.
Open interest is the number of contracts held by traders in active positions — they're not closed or expired. For Silver Futures this number is 136.90 K. You can use it to track a prevailing market trend and adjust your own strategy: declining open interest for Silver Futures shows that traders are closing their positions, which means a weakening trend.