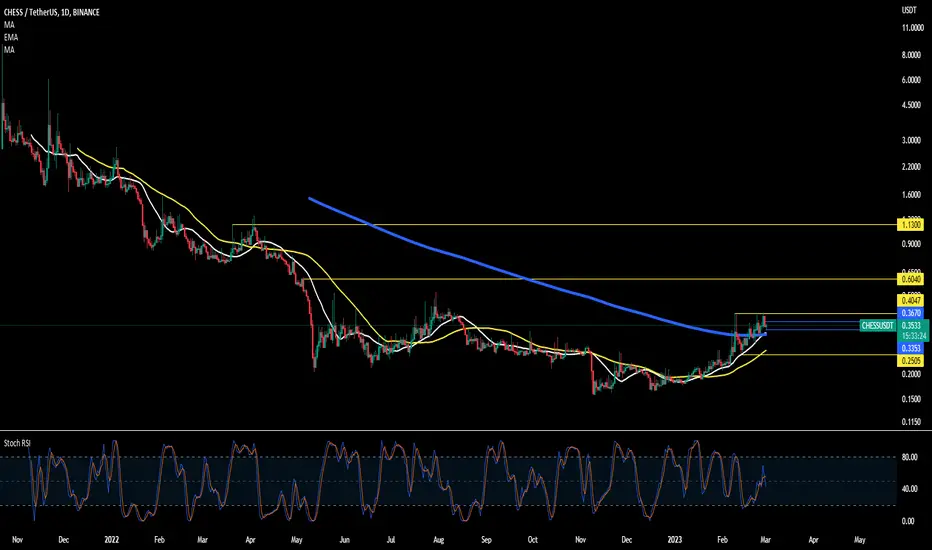
Tranchess (CHESS)On the above 1-day chart price action corrected 95% since last September. A number of reasons now exist to be long, including:
1) The ‘incredible buy’ signal.
2) Price action and RSI resistance breakout.
3) Price action price prints a higher low on the golden ratio. Fantastic.
4) Volume. Regardless of the price action volume accumulation continues.
5) On ‘what if’ list and already meets all conditions.
Is it possible for price action to fall further? Sure.
Is it probable? No.
Ww
Type: trade
Risk: <=6% of portfolio
Timeframe: 1 to 3 months
Return: no idea
3-day chart
CHESSUSDT trade ideas

CHESSUSDTNov 20
"As we enter the bullish season, the initial target to aim for is
target : 2.4 🎯.
This is based on a combination of technical analysis indicators and market trends.
However, it's important to approach trading with caution and adapt to changing market
conditions.
Keep an eye on key support and resistance levels, as well as any significant news or events that may impact the market.
Remember to use proper risk management techniques and consider setting profit targets along the way.
Happy trading!"

CHESSUSDT UNIQUE IDEA
CHESS has breaked the main Falling Wedge Pattern. Here it has Maximum chances we can see a good Bullish wave. We can see gain upto 35%.

$CHESSreclaimed previous range low
should attempt earlier range low as long as we stay above the yellow line

Chess 1d is very bullish and bottomedChess now is very bullish and looks solid especially if it maintains the current level of POC
Final goal could be the 618 fibo at the top
If it goes above the green area then it will reach point C
Your SL will be 1d closing below the Vol bottom for 1d

Chess is bullish if it... Chess is bullish if it matains the price above
1277 especially it is now trending above the POC which is the most critical area
If it closes in 40 mins above the 1277, then is is a good trade to enter in the current orange box
All the best insha Allah!


You will come out soonThe currency is on a downward path until the bottom at 0.11 cents
The mid-channel line is the true trend line
But after a while, the peaks and troughs were outside the path and were considered as the channel path
The next period will be outside the scope of the channel
The magic number of 1.618 is expected to be reached in Fibonacci points
At a price of approximately 0.80 cents
All of these are just predictions

CHESSUSDTCHSESSUSDT IS in bearish trend printing LH and LL.
No divergence shown in RSI.
We wait and watch for the breakout of last LL.

Chess Technical Analysis Shows Two Scenarios ?Scenario 1:-
Price of the asset is expected to correct and reach a strong buying area between 0.1600-0.1700 levels. This means that the price has been oversold and needs to cool off before continuing its upward journey. Once the correction is completed, the price might take support from 0.1600-0.1700 levels and move till 0.2300-0.2400 levels (trendline resistance).
Scenario 2 :-
There are two possibilities.
A. The first possibility is that the price might break below the strong buying area between 0.1600-0.1700 levels and continue its downward journey. This indicates that the bears have taken control of the market and the price is likely to go down further.
B. The second possibility is a fake breakdown, where the price breaks below the strong buying area but quickly returns back above it. This is a trap for short sellers who might sell in panic, providing liquidity for buyers to push the price up again.
Summary
Both scenarios involve the price of the asset correcting from its oversold state. It is important for traders to analyze the market carefully and use technical analysis tools to make informed trading decisions.
#plan your trade , trade your plan !

CHESS SPOT BUYChess is a chinese coin with the potential to flip follow me on my journey.
ENTER .2600
TP : .3200


$chess .4047 flip n fly bounced from range low
aiming for range high possibly higher IF we brekaout
stop is tiny lets see how it goes
ps:lowered stop a tad

#CHESS/USDT - Long - Potential 6.66%Direction: Long
Market: Spot
Risk: 0.25% - 1%
#USDT_CHESS
Exchange: BINANCE
Timeframe: 360
TP1: 0.2976
Entry: 0.2793
STOP: 0.261
Entry Conditions:
| Trendbreak
| Volume confirmed

CHESSUSDT 32.91% ✅🚀 in 2 Days#CHESSUSDT
we published and shared this idea with you in our profile here as you can check the previous analysis for #CHESSUSDT
and this analysis gave really good and massive profits
Target 1️⃣ : done✅
Entry price: 0.2458$✅
Price reached : 0.3267$ ✅
Profit: 32.91% ✅🚀🚀🤑
Period ⏰ : 2 Days 🔥🔥

CHESSUSDT#CHESSUSDT
there we have very important and strong support zone as you can see at the chart MACD is showing bullish RSI showing bullish EMAs is neutral ZELMA is showing uptrend-move Parabolic SAR is neutral buy and hold it to the next targets at the chart Accumulation distribution is bullish

Tranchess (CHESS) formed bullish Shark for upto 60% rallyHi, dear friends hope you are well and welcome to the new trade setup of Tranchess (CHESS) token.
Previously we caught almost 62% pump of CHESS as below:
Now on a daily time frame, CHESS has formed another bullish Shark move for another price reversal.
Note: Above idea is for educational purpose only. It is advised to diversify and strictly follow the stop loss, and don't get stuck with trade

$CHESS .3434 if i get will hop on currently bouncing from 200 ema looks to be the last test down before we go up up and away ..
3353 is range low on the hourly so take that into account for a stop hunt
recon 2-3 days more however with corn moving up and flipping 23700 this may pop earlier
send it kulie;)
Buying CHESS hereCHESS is showing some strenght, i am expecting small dip on a new 3D candle and then move up... targets 20-50% short term. GL
NOT A FINANCIAL ADVICE + MANAGE YOUR RISK AND USE STOPLOSS


#CHESS/USDT [Tranchess]: Super_Trend Bollinger_BreakoutWe've detected both a Bollinger Band breakout and a Super Trend pattern on the CHESS/USDT chart. Both indicators are signaling a bullish trend, with the Bollinger Band indicating a potential bullish trend as the price has moved outside of the upper band and the Super Trend showing a bullish trend. This is a stronger bullish signal as both indicators are aligned. It may be a good idea to consider buying at the current price zone and targeting higher levels. However, it is still important to consider other factors such as overall market conditions, and other technical indicators before making a trade decision.


Still Bullish on $CHESS 2X PLUS PUMPThis is a nice setup.
4HR is at a nice breakout point
BTC is currently at 20k and I am expecting it to go to 25k at lease hence this provides room for $CHESS to grow.
