ABC BullishPossible stop below C.
The target is D.
Targets calculated using the AB leg.
The Auto Fib Retracement tool on here can come in handy for this pattern and can nail C.
This is not to long entry level which is over the resistance of the last swing up.
No recommendation
ZMF2015 trade ideas
Sell Soymeal at Market - 1st TP 397.3 Stop 431.0Sell Soymeal at Market - 1st TP 397.3 Stop 431.0
**Trading commodity futures and options involves substantial risk of loss.
The recommendations contained in this letter is of opinion only and
does not guarantee any profits. These are risky markets and only
risk capital should be used. Past performance is not indicative of future results**
hypothetical performance results have many inherent limitations, some of which are described below. no representation is being made that any account will or is likely to achieve profits or losses similar to those shown. in fact, there are frequently sharp differences between hypothetical performance results and the actual results subsequently achieved by any particular trading program.
one of the limitations of hypothetical performance results is that they are generally prepared with the benefit of hindsight. in addition, hypothetical trading does no involve financial risk, and no hypothetical trading record can completely account for the impact of financial risk in actual trading. for example, the ability to withstand losses or to adhere to a particular trading program in spite of trading losses are material points which can also adversely affect actual trading results. there are numerous other factors related to the markets in general or to the implementation of any specific trading program which cannot be fully accounted for in the preparation of hypothetical performance results and all of which can adversely affect actual trading results.

Crush Margin CalcCM = SM * .80 + SO * .183 – SB
Where CM is the soybean crush margin ($/bushel)
SO is the value of soybean oil
SB is the value of full soybean

Sell Soymeal market, stop at 456.9, 1st TP at 404.8Sell Soymeal market, stop at 456.9, 1st TP at 404.8
**Trading commodity futures and options involves substantial risk of loss.
The recommendations contained in this letter is of opinion only and
does not guarantee any profits. These are risky markets and only
risk capital should be used. Past performance is not indicative of future results**
hypothetical performance results have many inherent limitations, some of which are described below. no representation is being made that any account will or is likely to achieve profits or losses similar to those shown. in fact, there are frequently sharp differences between hypothetical performance results and the actual results subsequently achieved by any particular trading program.
one of the limitations of hypothetical performance results is that they are generally prepared with the benefit of hindsight. in addition, hypothetical trading does no involve financial risk, and no hypothetical trading record can completely account for the impact of financial risk in actual trading. for example, the ability to withstand losses or to adhere to a particular trading program in spite of trading losses are material points which can also adversely affect actual trading results. there are numerous other factors related to the markets in general or to the implementation of any specific trading program which cannot be fully accounted for in the preparation of hypothetical performance results and all of which can adversely affect actual trading results.

Long positionSoybean meal future May 2022 - Sideway 470-490
Buy limit at 467 - 470
Stoploss: 464
Takeprofit 484.


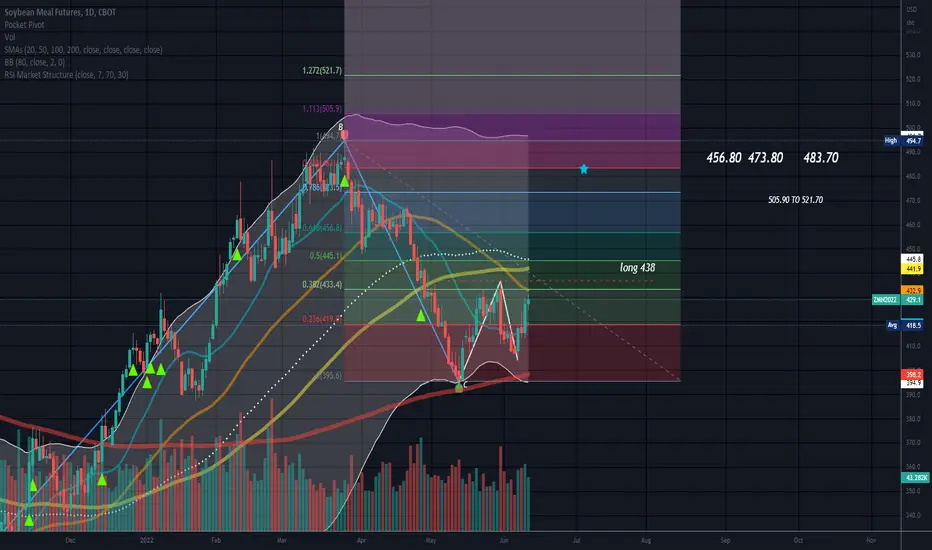
CUP & HANDLE VS. BEARISH DIVERGENCE - SOYBEAN MEALCup & Handle pattern => BULLISH
Divergence ( RSI ) in the overbought zone => BEARISH
We are at the 50% Fibonacci retracement level.
Who will win?

Start a News Trend upAs we Trade above 20days ma - Bulls are back and we can see a nice rally till first Resistance - will be interesting to see if we break it and continue.


Soybean Meal near end of the correctionIt looks like correction on Soybean Meal is almost over.
The price is approaching important resistance level. OBV does not follow the down movement and RSI is already in oversold territory.
I expect the market will turn in coming days.

SHORT /ZM- Double top, crossed neckline confirming the double top.
- Retracement to neckline, reversal.

There goes the bull marketIt is clearly bad from now on, the weekly buy zone at 408.3 - 411.3 did not hold and there is a tremendous sell force yesterday at the same zone.
399.4 is where the bulls must defend or else 376.4 is the target for this short entry at 408.3.

ZM1! Long (low confidence)RHS with a pullback and an inside bar on the daily.
Story doesn't align with anything on monthly or weekly

Traditional|ZM1!|LongLong ZM1!
Activation of the transaction only when the blue zone is fixed/broken.
The author recommends the use of anchoring fixed the blue zone, this variation is less risky.
If there is increased volatility in the market and the price is held for more than 2-3 minutes behind the activation zone after the breakdown, then the activation of the idea occurs at the prices behind the activation zone.
The idea is to work out the resistance level .
* Possible closing of a trade before reaching the take/stop zone. The author can close the deal for subjective reasons, this does not completely cancel the idea and is not a call to the same action, you can continue working out the idea according to your data, but without the support of the author.
+ Maybe right now we will go even lower, then it's okay, the idea is not activated and simply canceled.
+ ! - zone highlighted by the ellipse is a zone of increased resistance, in this area there is a possible reversal for a correction, please take this factor into account in this transaction.
The "forecast" tool is used for more noticeable display of % (for the place of the usual % scale) of the price change, I do not put the date and time of the transaction, only %.
Blue zones - activation zones.
Green zones - take zones.
Red zone - stop zone.
Working out the stop when the price returns to the level after activation + fixing in the red zone.
Orange arrow - the direction of take.
The red arrow - the direction of the stop.
SUM PNL: This parameter displays the total % of all closed ideas of the "new" format (according to the author) for this sector at the time of publication of the idea. The calculation is very "clumsy" just the sum of the profits of all the ideas, based on this indicator, you can more accurately assess the risks when working with my ideas of this sector. I present you the construction of the idea, you can use it yourself as you like based on your subjective view and risks, the calculation of the PNL indicator is carried out only on transactions that the author closed on TV in manual mode or by take.
P.S Please use RM (risk management) and MM (money management) if you decide to use my ideas, there will always be unprofitable ideas, this will definitely happen, the goal of the system is that there will be more profitable ideas at a distance.


Traditional|ZM1!|Long and shortLong and short ZM1!
Activation of the transaction only when the blue zone is fixed/broken.
The author recommends the use of anchoring fixed the blue zone, this variation is less risky.
If there is increased volatility in the market and the price is held for more than 2-3 minutes behind the activation zone after the breakdown, then the activation of the idea occurs at the prices behind the activation zone.
Working out the support and resistance levels of the consolidation zone.
* Possible closing of a trade before reaching the take/stop zone. The author can close the deal for subjective reasons, this does not completely cancel the idea and is not a call to the same action, you can continue working out the idea according to your data, but without the support of the author.
+ ! - zone highlighted by the ellipse is a zone of increased resistance, in this area there is a possible reversal for a correction, please take this factor into account in this transaction.
The "forecast" tool is used for more noticeable display of % (for the place of the usual % scale) of the price change, I do not put the date and time of the transaction, only %.
The breakdown of the upper blue zone - long.
Breakdown of the lower blue zone - short.
Working out the stop when the price returns to the level after activation + fixing in the red zone.
Blue zones - activation zones.
Green zone - take zone.
Red zone - stop zone.
Orange arrows indicate the direction of the take.
Red arrows indicate the direction of the stop.
Priority - The value of the priority parameter implies the author's subjective opinion about the more likely activation zone on this idea, this does not mean that this idea will be 80% activated by this parameter, the purpose of the parameter is to provide for the risk of the inverse of the zone parameter.
Example: "Priority Long: So the author inclines more in the direction of the activation zone open long trades, in this case, when reaching the activation zone in short you should be very careful, because this area may be highly likely to be punched about the breakdown/do not get to take/activate transaction from go to stop."
Please consider this parameter if you use my ideas.
SUM PNL: This parameter displays the total % of all closed ideas of the "new" format (according to the author) for this sector at the time of publication of the idea. The calculation is very "clumsy" just the sum of the profits of all the ideas, based on this indicator, you can more accurately assess the risks when working with my ideas of this sector. I present you the construction of the idea, you can use it yourself as you like based on your subjective view and risks, the calculation of the PNL indicator is carried out only on transactions that the author closed on TV in manual mode or by take.
P.S Please use RM (risk management) and MM (money management) if you decide to use my ideas, there will always be unprofitable ideas, this will definitely happen, the goal of the system is that there will be more profitable ideas at a distance.


Is it time to buy the retest ?Price started to form a liquidity zone in last week's trading and we started to see a liquidity grab move with a minor engulfing pattern at the last hours of the Friday session.
Price hit the lower lows of the liquidity zone and then form an engulfing candle. We could buy the retest here with targets above 440.
Always follow your trading plan regarding entry, risk management, and trade management.
Good luck!
~ Tuan Anh Commo

Long entry on upcoming retracementMeal has bypassed the critical zone of 384.7 - 435.8 with a monthly retracement way overdue. We have also arrived at the point where we were able to see from past rallies that this zone of pricing always indicated a reversal/retracement. We should be able to see a July '08 kind or May '12 kind of movement that will take place, hence, critical zone. Unless, the parabolic movement extends all the way to newer highs. This showed some equality in strength of buyers and sellers at this phase which will heighten the volatility. Fundamentally, nothing has changed for commodities market in general, still bullish. Ending stock still way below normal level. The length of this rally will very much depend on the worldwide pandemic development. Both production and demand in the next few months will have to be taken into account in effect of this pandemic. A very high price will eventually curb the demand but there is still a lot of room for this to eventually happen. Expect an incoming retracement to enter the buy position.

The Future Price Of Soybean Meal.Hello community, after a 5 wave (12345) impulsive structure we expect at least a corrective structure which contains lower degree impulses. Now the 5 wave impulse is getting completed and we expect bears to take over. I will keep updating this chart if necessary. Comment, like follow for more accurate ideas. Thank you.

Short ZM1 on H4 after breaking ending diagonalPrice hit the resistance zone on W and momentum got weaker. Moreover, an ending diagonal on H4 was appearing. I wait for the price that breaks the trend of ending diagonal then have a short position

ZMI am still staying with building my short position. There is too much of a bullish consensus in the market.

ZM, bean mealall the confirmation I need to load up on bean meal. the idea is to build a good position and follow the trend.
