Box on $CIThe hourly chart is set to move higher if the bullish crossover will be confirmed.
Bullish Alert already popped out and price action already made its move
CGN trade ideas

Cigna Squeezes After Sharp RallyCigna isn’t usually a very interesting stock. However, it jumped last week and some traders may see the potential for more upside.
The first pattern on today’s chart is the bullish gap on December 11 after the health insurer cancelled its planned merger with NYSE:HUM Humana. (Management will instead spend $10 billion on stock buybacks.) Share volume hit the highest level in over four years, while its 17 percent gain represented the biggest price surge since February 2009.
Second is the November 24 peak around $290. CI held that level last Friday and Monday. Has old resistance become new support?
Third is the falling trendline since the initial jump. The resulting tight consolidation pattern may create potential for a breakout and continuation of the initial thrust.
Fourth, the longer-term trend may have changed in September when the 50-day simple moving average had a “golden cross” above the 200-day SMA.
Finally, the last quarterly report on November 2 featured better-than-expected results and higher guidance. Now that investors can stop worrying about the merger, will they focus more on CI’s individual fundamentals?
TradeStation has, for decades, advanced the trading industry, providing access to stocks, options, futures and cryptocurrencies. See our Overview for more.
Important Information
Past performance, whether actual or indicated by historical tests of strategies, is no guarantee of future performance or success. There is a possibility that you may sustain a loss equal to or greater than your entire investment regardless of which asset class you trade (equities, options, futures or cryptocurrencies); therefore, you should not invest or risk money that you cannot afford to lose. Online trading is not suitable for all investors. View the document titled Characteristics and Risks of Standardized Options at www.TradeStation.com . Before trading any asset class, customers must read the relevant risk disclosure statements on www.TradeStation.com . System access and trade placement and execution may be delayed or fail due to market volatility and volume, quote delays, system and software errors, Internet traffic, outages and other factors.
Securities and futures trading is offered to self-directed customers by TradeStation Securities, Inc., a broker-dealer registered with the Securities and Exchange Commission (“SEC”) and a futures commission merchant licensed with the Commodity Futures Trading Commission (“CFTC”). TradeStation Securities is a member of the Financial Industry Regulatory Authority, the National Futures Association (“NFA”), and a number of exchanges. TradeStation Crypto, Inc. offers to self-directed investors and traders cryptocurrency brokerage services under federal and state money services business/money-transmitter and similar registrations and licenses.
TradeStation Securities, Inc., TradeStation Crypto, Inc., and TradeStation Technologies, Inc. are each wholly owned subsidiaries of TradeStation Group, Inc., all operating, and providing products and services, under the TradeStation brand and trademark. TradeStation Crypto, Inc. offers to self-directed investors and traders cryptocurrency brokerage services. It is neither licensed with the SEC or the CFTC nor is it a member of NFA. When applying for, or purchasing, accounts, subscriptions, products and services, it is important that you know which company you will be dealing with. Visit www.TradeStation.com for further important information explaining what this means.

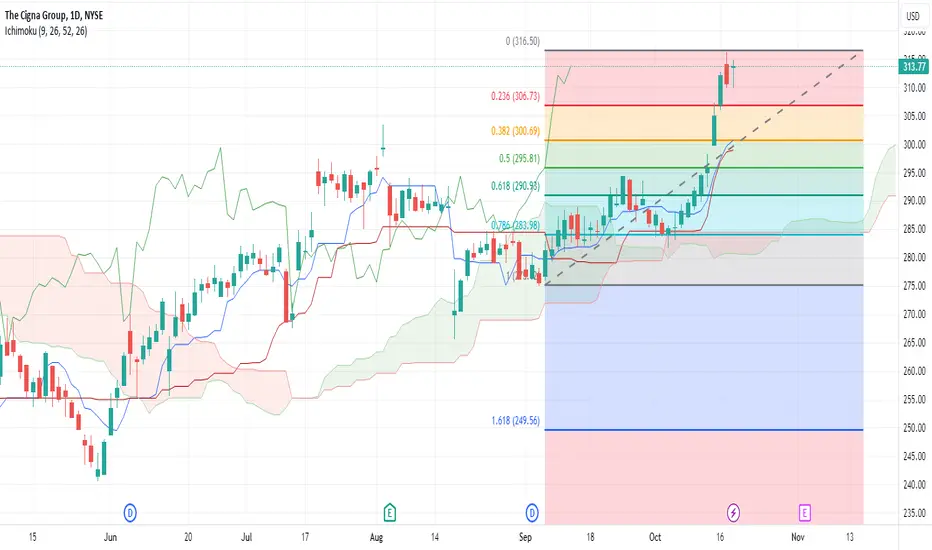
Cigna Bull CaseI like using classic patterns. I like to keep things simple. I used to throw a million indicators on a chart and thought it was helping. But now I do not. I may use RSI, MACD, or a Delta Volume lower study. Other than that I only ever use a couple of moving averages, maybe VWAP on the chart above. But here I have used Fibonacci Triangle pattern to identify a long term trend on Cigna. This makes sense. As the health insurance market would cause the stock to stagnate during the summer and autumn months. In the USA, people are only enrolling in new plans for health insurance during the Winter and Spring. That is soon to come, and I will expect large profits for CIGNA in the coming months. I would personally buy a Diagonal Call spread on CI. I would maybe sell a call around the 350 strike for early december and buy maybe the 360 Strike on sometime in february. These diagonal positions allow you to profit from the favorable aspects of both the vertical and the calendar spread at the same time. If you go wide enough with them strike and date wise, it can be hard to lose on them barring a black swan event. Especially if you use a double diagonal, legging in with another on the other side of the option chain. This is similar to an iron condor, with a big difference, your risk is much higher but your actual likelihood of losing can be made to be almost non-existent. They are Vega and Theta positive. Which means that if volatility shoots up and price starts dropping on you, it gains value, allowing you to either adjust, or exit for a profit.

Bat and Crab on CIBearish Bat on CI
You can ride the journey on CD as the final leg of the bearish bat pattern completes.
TP1: 88.6 % of XA when the bearish bat pattern is complete.
If trend turns bearish at that point, CI can be shorted all the way down to 38.2% of AD and then to 61.8% of AD.
If the uptrend continues ie. beyond TP1, the pattern will then be a crab pattern. You can then ride the extended CD journey upwards. In this case TP2 = 161% of XA.

CI short positionCI looks bullish. The price remains in the channel.
We're expecting the price to reach the upsloping resistance line and will come back to retests the upsloping support.
Our strategy is to entry short when it occurs.
Invalidation of this thesis would be if the price closes above the upsloping resistance.

OverboughtLike many shares today the stock is overbought and a correction is long due. Yesterday we've seen a desperate attempt to reach the February high again. But neither this nor the January low could be reached again. The bulls have run out of velocity immediately. The upper range of the Donchian Channel is an additional resistance to be overcome for a continued rise. Yesterday we had opened with a window which is still open and has to be closed again. But I admit that the window may support the price for a little wile so that there may be 1 or 2 sideward days now.
All in all I support the idea of a correction to begin soon. The weekly Fibonacci levels and the VWAPs also support my idea,
By the way, if the day ends with a Hanging Man this will be a good signal for a beginning correction.
$CI with a bullish outlook following its earnings #StocksThe PEAD projected a bullish outlook for NYSE:CI after a positive under reaction following its earnings release placing the stock in drift A with an expected accuracy of 77.78%.


CIGNA Stock Chart Fibonacci Analysis 060823 Trading Idea
1) Find a FIBO slingshot
2) Check FIBO 61.80% level
3) Entry Point > 253/61.80%
Chart time frame : C
A) 15 min(1W-3M)
B) 1 hr(3M-6M)
C) 4 hr(6M-1year)
D) 1 day(1-3years)
Stock progress : A
A) Keep rising over 61.80% resistance
B) 61.80% resistance
C) Hit the bottom
D) Hit the top
Stocks rise as they rise from support and fall from resistance. Our goal is to find a low support point and enter. It can be referred to as buying at the pullback point. The pullback point can be found with a Fibonacci extension of 61.80%. This is a step to find entry level. 1) Find a triangle (Fibonacci Speed Fan Line) that connects the high (resistance) and low (support) points of the stock in progress, where it is continuously expressed as a Slingshot, 2) and create a Fibonacci extension level for the first rising wave from the start point of slingshot pattern.
When the current price goes over 61.80% level , that can be a good entry point, especially if the SMA 100 and 200 curves are gathered together at 61.80%, it is a very good entry point.
As a great help, tradingview provide these Fibonacci speed fan lines and extension levels with ease. So if you use the Fibonacci fan line, the extension level, and the SMA 100/200 curve well, you can find an entry point for the stock market. At least you have to enter at this low point to avoid trading failure, and if you are skilled at entering this low point, with fibonacci6180 technique, your reading skill to chart will be greatly improved.
If you want to do day trading, please set the time frame to 5 minutes or 15 minutes, and you will see many of the low point of rising stocks.
If want to prefer long term range trading, you can set the time frame to 1 hr or 1 day.

June Losers (CI, account down 0.95%)4th trade in June is NYSE:CI .
Holding period is 0 day.
Account is down 0.95%.
Total return in June is 1.83%.

"Cheap"Around the highs 2 years ago we seem to consolidate. Not so far away are the 3 year highs from 2018 until 2021. It is interesting that the stock could regain the Covid depression very fast and reach a new high. The rise after the Covid drop may be considered as corrected now as the bottoms of both channels, weekly and monthly, are reached. Thus I see if not the renewal of the uptrend so an upward correction much likely.

The Cigna Group to break the resistance?CIGNA CORPORATION - 30d expiry - We look to Buy a break of 270.11 (stop at 260.11)
The primary trend remains bullish.
Posted a Double Bottom formation.
A break of the recent high at 269.36 should result in a further move higher.
This stock has seen good sales growth.
The bias is to break to the upside.
Our profit targets will be 295.11 and 300.11
Resistance: 258.50 / 265.0 / 269.36
Support: 254.50 / 251.00 / 240.50
Please be advised that the information presented on TradingView is provided to Vantage (‘Vantage Global Limited’, ‘we’) by a third-party provider (‘Signal Centre’). Please be reminded that you are solely responsible for the trading decisions on your account. There is a very high degree of risk involved in trading. Any information and/or content is intended entirely for research, educational and informational purposes only and does not constitute investment or consultation advice or investment strategy. The information is not tailored to the investment needs of any specific person and therefore does not involve a consideration of any of the investment objectives, financial situation or needs of any viewer that may receive it. Kindly also note that past performance is not a reliable indicator of future results. Actual results may differ materially from those anticipated in forward-looking or past performance statements. We assume no liability as to the accuracy or completeness of any of the information and/or content provided herein and the Company cannot be held responsible for any omission, mistake nor for any loss or damage including without limitation to any loss of profit which may arise from reliance on any information supplied by Signal Centre.

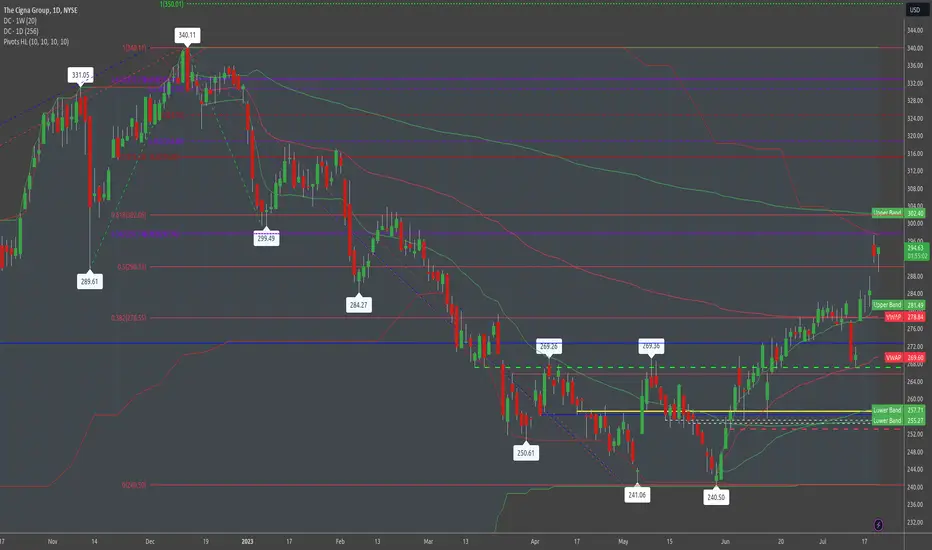
Cigna Group, RSI Bullish Divegrence at the 800 Day EMACigna is showing quite a bit of RSI Bullish Dievegrence as it trades at the 800-Day EMA for the second time; we could eventually see this result in a rally to atleast make a 50%-78.6% retrace.

CI - Up Channel Continuation Looking for continuation of the up channel with the formation of this right shoulder of a head and shoulders pattern.
The right shoulder is shown with the bars pattern and could possibly touch the red trend line.
I think however the channel will maintain.

Long Cigna @ 248.75Mean reversion trade. Keeping in mind 250-251 support broke and the broader market is selling off aside from small pockets.
I'll be watching closely to see if 250 now flips to resistance or if it's a bear trap and big bounce. Stop loss tight.
Entry: 248.75
Stop Loss: 247.75
Target: 255
The market does not seem to care about UNH, Elevance, Centene & Humana all posting strong earnings and relatively strong guidance!

Cigna for a Trade @ 253.5030 minute strong reversal candle close
Entry: 253.50 (support)
Stop loss: 252.90
Levered with long call options. No hedge against it.

Cigna "Last Call" Bull TradeMy Position
Initial Buy: 256.50
Second Buy: 259.50
Total Average: 258
Stop Loss: 256
Price Target: 278.50
Here is an example of a "Last Call" bullish entry. I am forecasting an explosive move upwards post United Health Group earnings tomorrow. This has been a laggard compared to its main peers UNH and Humana.
Entry: 261.32 (20 day moving average on the 4 hour chart which has served as consolidation support since April 5th)
Stop loss: 258.45
Price Target: 278.50
Risk to Reward: 1 : 5.99
If you move to the 4 hour chart, you can see the trading range has been getting tighter and tighter as the 20MA and 50MA moving averages converge. This signals to me a big move is coming.
Conditions on being wrong in this trade: A 4 hourly candle close below the 4HR 20MA(yellow) and failure to recapture it in the following 2 4 hr candles OR stop loss is triggered.

Cigna to 278. Nearing the bottom of the right shoulder on an inverse H&S. Gap filling 255 before launching. Implied target of the IH&S takes you to an area of confluence being the previously failed IH&S neckline.

CI | A Great Pick | LONGThe Cigna Group, together with its subsidiaries, provides insurance and related products and services in the United States. Its Evernorth Health Services segment provides a range of coordinated and point solution health services, including pharmacy benefits, home delivery pharmacy, specialty pharmacy, distribution, and care delivery and management solutions to health plans, employers, government organizations, and health care providers. The company's Cigna Healthcare segment offers medical, pharmacy, behavioral health, dental, and other products and services for insured and self-insured customers; Medicare Advantage, Medicare Supplement, and Medicare Part D plans for seniors, as well as individual health insurance plans; and health care coverage in its international markets, as well as health care benefits for mobile individuals and employees of multinational organizations. The company also offers permanent insurance contracts sold to corporations to provide coverage on the lives of certain employees for financing employer-paid future benefit obligations. It distributes its products and services through insurance brokers and consultants; directly to employers, unions and other groups, or individuals; and private and public exchanges. The company was formerly known as Cigna Corporation and changed its name to The Cigna Group in February 2023. The Cigna Group was founded in 1792 and is headquartered in Bloomfield, Connecticut.

$CI with a bullish outlook following its earnings #Stocks The PEAD projected a bullish outlook for $CI after a positive over reaction following its earnings release placing the stock in drift B with an expected accuracy of 90.91%.

CIGNA CORPORATION - LONGPrice seems to be pulling back from this pull back area - continuation of uptrend?

$CI with a Bullish outlook following its earnings #Stocks The PEAD projected a Bullish outlook for $CI after a Positive Under reaction following its earnings release placing the stock in drift A with an expected accuracy of 75%.
