BTC?
Hi
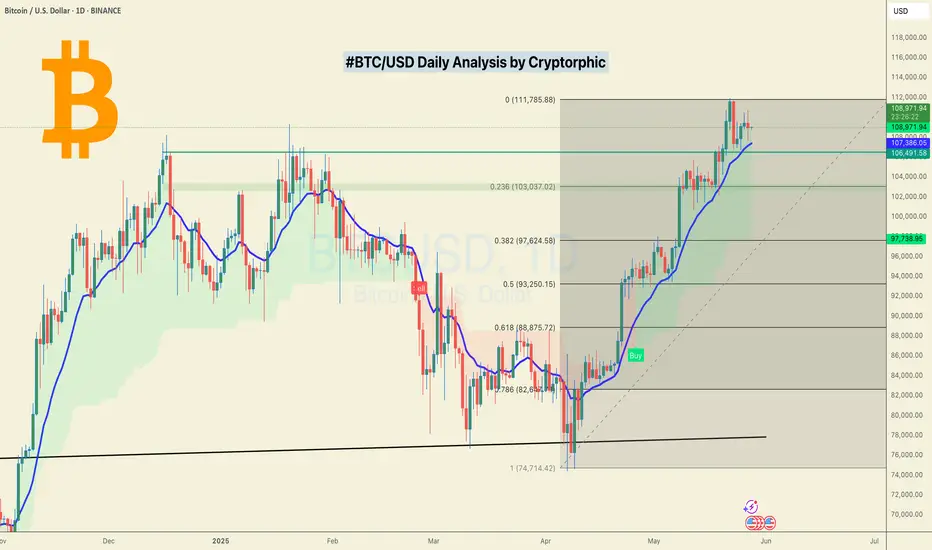
I am still bullish.
Arrows = touch points
in this next touch point
will focus on buys.
It may not be accurate. but it does give some idea where i should buy my ticket.
There.. find best setup for yourself.
if 1 setup doesn't work
GOTO 2nd setup (if any came up)
Use any setup up that is inline with your biases.
All the best
NOt a guru
BTCUSD trade ideas

#BTC/USD The Uptrend is still intact! Here's Why!BTC Daily Close Update
Bitcoin closed at $108,951, marking another failed attempt to break through the $111K resistance.
It’s been nearly 8 days of consolidation just below this level. That’s not ideal, and it signals we may need a fresh catalyst to push higher.
Not bearish, just cautious.
As long as the blue EMA holds on the daily, the uptrend remains intact.
Still watching for a move toward $117K.
DYOR, NFA
Please show your support with your likes.
Thank you
#PEACE


BTC at Crossroads: Rejection from ATH or Breakout.Key Zones Highlighted:
🟥 Recent ATH and Resistance Level (~$111,000 - $112,000)
The price recently tested this area, forming a new All-Time High (ATH).
This zone has acted as a major resistance, causing a pullback.
A break and close above this range would indicate bullish continuation.
🟩 Support Zone (~$105,000 - $106,000)
Price previously bounced from this zone.
Currently acting as a mid-level demand/support.
Likely to be tested again if bearish pressure continues.
🟩 Strong Supply Zone (~$102,000 - $103,500)
A more significant support area, where previous buying pressure emerged strongly.
If the upper support fails, this becomes the next possible bounce zone.
Price Action and Projection:
Price is currently at $108,209 and moving within a correction phase.
Two potential scenarios are highlighted on the chart:
Bullish Continuation:
Price rebounds from current level (black circle) and breaks above the resistance zone.
Targets new highs beyond $112,000.
Bearish Pullback:
Price fails to sustain above current level and dips into the support zone (~$105K).
If strong buying interest appears, a bounce back to the ATH zone is expected.
Technical Outlook:
Ichimoku Cloud: Price is testing the Kumo (cloud), indicating neutral to slight bearish momentum.
Volume: Slight uptick in volume during the recent drop suggests sell pressure is increasing.
Structure: Price is forming a higher high and potentially a higher low, maintaining a bullish structure as long as support holds.
Conclusion:
BTC is in a critical zone with mixed signals. A decisive move from the current level will likely set the tone for the next 24–48 hours. Watch:
A bounce at ~$108K for bullish continuation,
A dip toward $105K for potential re-entry opportunities.
Let me know if you’d like trade setup suggestions based on this.

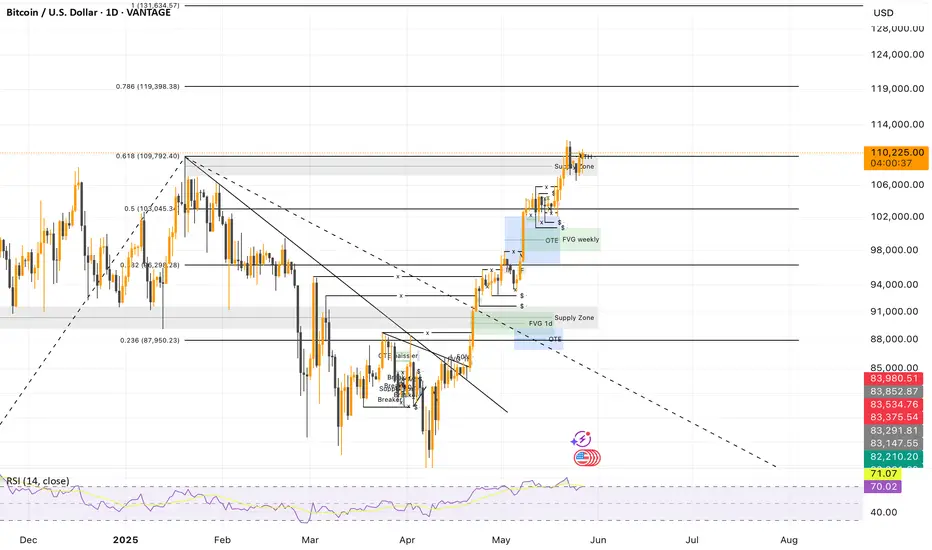
Are we seeing UTAD on BTC?Bitcoin has been in ana scending channel for a while but ever since the new all time high, some things make me doubt we see a continuation of the bull trend in the near term.
-Volume has been declining the entire length of the channel
-We saw a bump in volume but the effort didn't match. A lower volume red candle had the same impact on price.
-The new all time high resulted in a third touch of bearish divergence on the MACD. Also the MA's are showing bearishness.
-The RSI fell below the EMA and is now looking like it's resisting breaking through.
We are clearly in a supply zone and all signs point to absorption and distribution taking place.
104k is the next level that will offer any significant support.

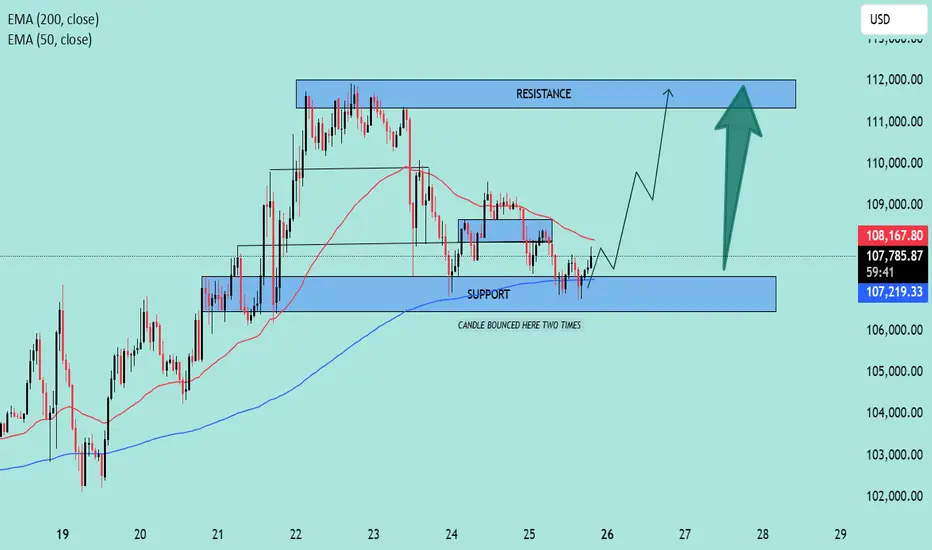
BTC/USD Rebound in Play! | Key Support Holding, Eyes on $112K📊 BTC/USD Technical Analysis
🗓️ Chart Date: May 25, 2025
🔍 Key Levels:
🔵 Support Zone: $106,800 – $107,300
Notably, price bounced twice in this region, indicating strong buying interest.
This area aligns closely with the 200 EMA (currently at $107,213.51), adding further confluence as dynamic support.
🔴 Resistance Zone: $111,800 – $112,300
Previous highs and consolidation make this a significant area where sellers may re-enter the market.
📈 Indicators:
🔵 EMA 200 (Blue): $107,213.51
Acts as a strong dynamic support; price bounced off it recently.
🔴 EMA 50 (Red): $108,182.91
Price is currently below the 50 EMA, suggesting short-term bearish pressure remains until this level is reclaimed.
🧠 Market Structure & Price Action:
After a sharp drop from the resistance zone, price found solid footing at the support zone.
Recent candles show rejection wicks from the downside, hinting at potential bullish reversal.
A breakout above minor consolidation and 50 EMA could trigger a bullish continuation toward the resistance.
📌 Forecast:
✅ If the price holds above the support zone and breaks above $108,200, we can expect a bullish move toward $112,000.
⚠️ However, a failure to break above the 50 EMA could lead to a retest of the support zone.
🧭 Trade Idea (Not Financial Advice):
📥 Long Bias:
Entry: On confirmed breakout above $108,200
SL: Below $107,000
TP: $111,800 – $112,300
📌 Conclusion:
The chart setup suggests a potential bullish reversal 📈 from a key support zone, supported by EMA 200. Watch for a break above the 50 EMA for momentum confirmation.
🧠 Always confirm with volume and wait for confirmation before entering a position.
Bitcoin longs at risk - caution advised- dealing with a possible ATH SFP here
- looking at the 3D time-frame, with stoch momentum exhausted, RSI reaching overbought territory and most importantly volatility being very low it is possible top longers are about to get smoked
- a correction anywhere between the 0.382 and 0.5 fib is possible
- nothing confirmed at the time of writing but it is likely that trading back under 105k would be confirmation enough that the bigger correction is on its way
Some potentially very concerning things on time-frames starting with the weekly and higher but not relevant at this point in time.

SELL & BUY- Basics1. Get construction licence.
2. Sell and buy 3 houses. (Hannah-1 FHA. Jon-1 FHA, Jon- 2nd house FHA Single Family Rent it out)
3. Still live in a duplex/Triplex/Quadraplex.
4. Married, then start flipping houses.
34 yrs old draft plans for dream home. (San Pedro, Maywood, Imperial Beach SD, Palmdale , Mexico)

BTCUSD🚨 SELL ALERT – BTC/USD 🚨
📉 Action: Sell BTC/USD
🕒 Timing: Immediate Entry
📊 Reason: Bearish signals detected – momentum shifting downward
🎯 Recommendation: Enter with proper risk management
Set Stop-Loss to protect capital
Set Take-Profit zones based on your risk/reward strategy
Short-term downside expected — move smart and monitor price action closely.

Bitcoin (BTC) As of May 27, 2025As of May 27, 2025, Bitcoin (BTC) is trading at approximately $110,353, reflecting a 1.08% increase over the past 24 hours.
Weekly Outlook:
Bitcoin has recently reached a new all-time high of $111,970, driven by significant institutional investments and favorable regulatory developments. Notably, Michael Saylor's company, Strategy, has acquired over 4,000 additional bitcoins, bringing its total holdings to 580,250 BTC, approximately 2.7% of the total supply. Investor's Business DailyFinancial News London+1Investor's Business Daily+1
Technical Analysis:
Support Levels: Immediate support is observed around $107,000, with stronger support near $103,400.
Resistance Levels: Key resistance is identified at $110,000, with further resistance at $112,000.
Indicators: Technical indicators suggest a neutral to bullish outlook, with the Relative Strength Index (RSI) approaching overbought territory, indicating potential for continued upward movement but also cautioning against possible pullbacks.
Short-Term Predictions:
Binance forecasts a potential increase to $110,449.67 by the end of this week. Binance
Changelly predicts a rise to $120,379.09 by May 28, 2025. changelly.com
Conclusion:
Bitcoin's current momentum is supported by institutional adoption and favorable regulatory developments. While short-term volatility is expected, the overall trend remains bullish. Investors should monitor key support and resistance levels and stay informed about macroeconomic factors that could influence market sentiment.

Still Strong Uptrend!Bitcoin (BTC-USD) Eyes $115K: Can the $10 Trillion Dream Become Reality?
Bitcoin is not pausing. Hovering just under $110,000, BTC-USD is moving with new capital, DeFi expansion, and institutional accumulation behind it—fueling one of the most aggressive pushes since the 2021 cycle. At $109,703, after printing an all-time high of $111,769 last week, the asset is rangebound between $107,500–$109,000 as volatility tightens ahead of the PCE inflation report and the flagship Bitcoin 2025 Conference.
DeFi on Bitcoin: From Digital Gold to Active Financial Infrastructure
A silent transformation is underway. Bitcoin isn’t just the digital gold it once was—it’s becoming programmable capital. The total value locked (TVL) in Bitcoin-based DeFi protocols has surged over 2,000% since 2024, hitting $6.67 billion. That figure isn’t just a milestone—it signals Bitcoin’s usability leap.
DeFi use cases now include collateralized loans, on-chain derivatives, decentralized exchanges, and algorithmic stablecoins—built directly on Bitcoin infrastructure. This is not passive holding; it’s an activated network that attracts capital with yield, utility, and interoperability. Bitcoin’s network is now monetizing time and trust.

BTC/USD 4h Chart ReviewHello everyone, I invite you to review the current situation on BTC. When we enter the four-hour interval, we can see how the BTC price is moving in the upward trend channel, in which several upward waves can be marked, which may indicate the beginning of another wave of growth.
Here you can see how the current rebound has brought the movement closer to a strong resistance zone from $ 110,400 to $ 113,200, only breaking out of this zone on top can give the price an increase in the area of strong resistance at $ 121,000.
Looking the other way, you can see that when the trend reverses, we first have a support zone from $ 106,600 to $ 105,400, however, if this zone is broken, we can see a quick return of the price to the area of strong support at $ 102,000.
The RSI indicator shows how a support line was formed from which the indicator bounced many times, giving the price an increase, while the MACD indicator maintained the upward trend and created room for another upward movement when the price recovered.

SHORT $BTCBitcoin has recently retraced back to a key level of support-turned-resistance (SNR), a zone that has historically acted as a strong rejection point. Price action is showing signs of exhaustion, with lower momentum and rejection wicks forming near this level.

BTCUSD Trade Setup – May 27, 2025 Currently watching BTC/USD as it approaches a key resistance liquidity zone near 111,200–111,376. Price has been consolidating below this level, showing signs of accumulation but no breakout yet.
📍 My Plan:
Sell Setup: I’m waiting for price to tap into the red zone and show signs of exhaustion.
Confirmation: I’ll look for:
Volume fading near the top.
Order flow shift (aggressive buyers trapped, sellers stepping in).
Divergence if available.
If confirmed, I’ll enter a short position aligned with intraday order flow.
🎯 Targets:
TP1: 108,360 (mid-range support + previous VWAP level)
TP2: 106,000 (major demand zone / full take-profit)
❌ Invalidation:
If price breaks and holds above 111,376 with strong volume and bullish momentum, I will stay out and reassess.
🔁 This is a reaction-based setup, not a blind sell. I’m waiting for the sweep and real confirmation before executing.
📉 Let’s see how BTC reacts at the top.
#BTCUSD #Bitcoin #CryptoTrading #ShortSetup #PriceAction #OrderFlow

BITCOIN SHORT-TERM 2025Trump’s tariff threats have sparked market volatility and liquidity concerns, and these effects could persist for some time. For the FED, no rate cuts in March and April (May) look solid; June’s cut depends on evolving conditions—tariff impacts, liquidity, and inflation trends will be key. A declining DXY and rising global M2 (BTC has 80%+ correlation) could also support a cut.

BTC/USD – 1D Analysis
1️⃣ Market Structure
BTC remains ultra bullish. A new high was hit last week at 112K.
Since then, price is consolidating slightly around 110K with no major weakness showing.
2️⃣ Key Levels
📍 Main support: 108K (previous ATH)
🎯 Current resistance: 112K
🧭 Fibo extensions: targets projected at 130K–135K
3️⃣ Context & Momentum
🏦 Institutional interest remains strong
💵 Weakening USD = bullish for BTC
⚖️ Overall sentiment still favors upside despite market caution
4️⃣ Scenarios to watch
📈 Bullish: Break above 112K could trigger a run to 130K+
📉 Bearish: Break below 108K may open room for a retest of 103–100K
✅ Conclusion
BTC is gearing up for the next leg. As long as 108K holds, the bias stays bullish.
📆 This week could be the one that triggers the breakout.
Market next move
Bullish Disruption Scenario
1. False Resistance Breakdown:
The red zone marked as resistance may fail to hold. The recent strong bullish candle and volume spike hint at possible accumulation rather than rejection.
2. Breakout and Retest Play:
Price could break above the resistance zone, retest it as new support, and then continue higher—invalidating the expected red and blue downward paths.
3. Volume Behavior:
The most recent green volume spike could signal strong institutional buying, which often precedes a breakout.
4. Higher Lows Formation:
Price structure is creating higher lows, which is a bullish signal in consolidation before breakout.
5. Market Sentiment:
If upcoming U.S. macroeconomic data (see flag icons) is dovish or supportive of crypto risk-on assets, BTC could rally sharply.

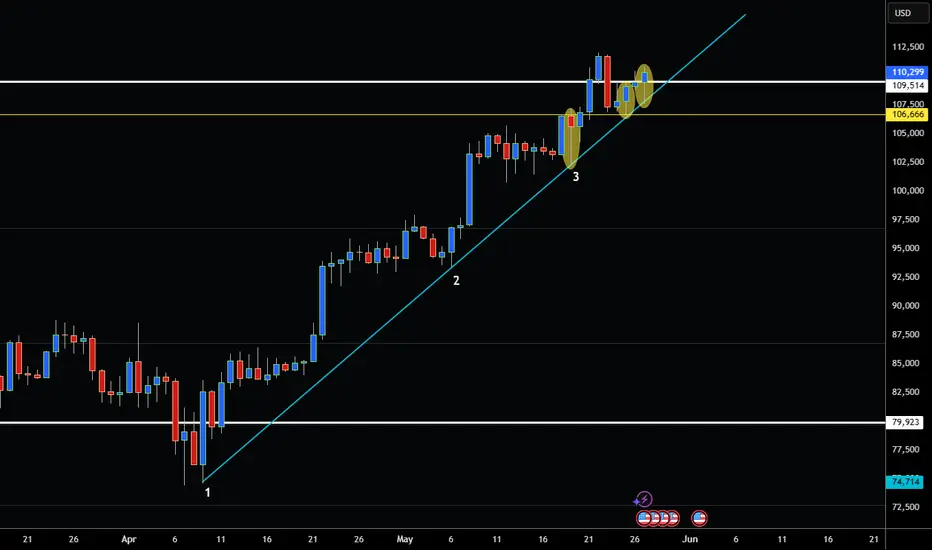
Bitcoin Hammers Everywhere Uptrend Showing StrengthHey Traders so today want to take a quick look at Bitcoin. This is why I use the daily charts because you can truly see where the market closed after the trading day was over. I have highlighted some Hammer Candles on the chart. This means the market tries to go lower but then is rejected from the lows. This is normally a continuation signal in strong trends. So anotherwords if you see a Hammer Candle at the trend line the market is normally telling you to buy!
So you buy the day after the candle closes or if you want be more conservative look for a 50% retracement of the the hammer and then buy. Put a stop loss below the low of the Hammer or in a place to give the market breathing room just in case it reverses on you.
So if your bullish Bitcoin buy when you see hammers but if your bearish wait for a close underneath strong support like maybe 105,000 or even better wait for top formation!
Always use Risk Management! (just in case your wrong in your analysis)
Hope This Helps Your Trading 😃
Clifford
Bitcoin Clears Key Resistance as Bulls Maintain Grip on UptrendBitcoin (BTC/USD) has officially broken above the psychologically and technically significant 108,500 zone, confirming bullish continuation:
Trendline Support Holds: The rising trendline from March remains intact and continues to guide the advance.
Breakout Confirmation: Price is now comfortably above previous resistance at 108,500, turning it into new support.
Momentum Strong: MACD remains firmly in bullish territory, while RSI is pushing into overbought levels—suggesting strong upside but warranting caution.
Next Resistance: Little stands in the way until 115,000 and potentially 120,000 if momentum persists.
Watch for Retest: Short-term consolidation or a retest of the 108,500 zone could provide a healthier base for further gains.
Bitcoin remains in bulls' control unless we see a decisive drop back below trendline support.
-MW

Bitcoin Hits New All-Time Highs — Rally Targets $130K+Bullish Momentum Accelerates:
Bitcoin has reached new all-time highs, confirming a strongly bullish technical outlook. Accelerating upside momentum and growing investor confidence are driving the current rally.
Breakout Confirmation:
A decisive breakout from a broadening wedge pattern has unlocked potential targets in the $130,000–$135,000 range, signaling a likely continuation of the uptrend.
Key Support Levels:
With Bitcoin now trading well above $106,000, the previous resistance at $108,000 is expected to act as strong support during any pullbacks — providing a clear risk threshold for traders.
Favorable Risk-Reward Setup:
This alignment of:
Strong momentum
Completed consolidation
Successful breakout
...creates a compelling risk-reward scenario and reinforces the case for continued upside in the current bull cycle.
Bitcoin may just be getting started on its next leg higher. 🚀🔥
#Bitcoin #BTC #AllTimeHigh #Crypto #TechnicalAnalysis #Bullish #Breakout #MarketMomentum #CryptoTrading #CryptoMarket

BTC Conference Rally – Caution Advised | Sell-the-News SetupBitcoin is currently trading near ~$110K as the Bitcoin 2025 Conference kicks off today in Las Vegas, featuring major political and institutional figures. Price has been grinding higher into the event — but historically, Bitcoin conferences have marked short-term tops.
🔍 Historical Context:
Bitcoin 2024 (Nashville): BTC dropped ~30% post-conference
Bitcoin 2022: Immediate 10% pullback after day 2
These events often show classic “buy the rumor, sell the news” patterns
📉 Current Risk Setup:
RSI (4H): ~56 – neutral momentum, no breakout confirmation
Volume: Fading on green candles – weak demand on markup attempt
Support Zones:
108K = 55 SMA (first dynamic support)
107K = Lower Bollinger Band
105.8K = Last structural support from reaccumulation
Any close below 108K with rising volume could be the first sign of a shift. Breakdown below 105.8K would confirm a deeper move toward 101K.
🧠 Final Thoughts:
With expectations peaking and historical patterns aligning, caution is warranted. Let the chart confirm — but be aware that emotional euphoria around conferences has often been a liquidity trap.
🎯 Stay patient. Let price and volume lead.
#Bitcoin #BTCUSDT #CryptoWarning #SellTheNews #BTCConference #TechnicalAnalysis

BTCUSD INTRADAY Bullish energy buildup supported at 107,650Trend Overview:
Bitcoin (BTC/USD) remains in a bullish trend, characterized by higher highs and higher lows. The recent intraday price action is forming a continuation consolidation pattern, suggesting a potential pause before a renewed move higher.
Key Technical Levels:
Support: 107,650 (primary pivot), followed by 103,330 and 100,680
Resistance: 113,040 (initial), then 115,510 and 117,510
Technical Outlook:
A pullback to the 107,650 level, which aligns with the previous consolidation zone, could act as a platform for renewed buying interest. A confirmed bounce from this support may trigger a continuation toward the next resistance levels at 113,040, 115,510, and ultimately 117,510.
Conversely, a daily close below 107,650 would suggest weakening bullish momentum. This scenario would shift the bias to bearish in the short term, potentially targeting 103,330 and 100,680 as downside levels.
Conclusion:
BTC/USD maintains a bullish structure while trading above the 107,650 support. A bounce from this level would validate the consolidation as a continuation pattern, with upside potential toward the 117,500 area. A breakdown below 107,650, however, would invalidate this view and suggest deeper corrective risk.
This communication is for informational purposes only and should not be viewed as any form of recommendation as to a particular course of action or as investment advice. It is not intended as an offer or solicitation for the purchase or sale of any financial instrument or as an official confirmation of any transaction. Opinions, estimates and assumptions expressed herein are made as of the date of this communication and are subject to change without notice. This communication has been prepared based upon information, including market prices, data and other information, believed to be reliable; however, Trade Nation does not warrant its completeness or accuracy. All market prices and market data contained in or attached to this communication are indicative and subject to change without notice.

Bitcoin Breaking Out AgainBitcoin has cleanly broken above multiple resistance levels and is holding above $109,358, showing strong bullish momentum. The golden cross between the 50 MA and 200 MA (visible in earlier charts) continues to play out as a bullish confirmation. After retesting and bouncing from the $88,804 level in late April, Bitcoin has been in a strong uptrend.
Volume is slightly tapering off compared to the initial breakout, but the price action remains constructive. We’re now consolidating just above previous resistance at $109,358, which could act as support moving forward. As always, while the trend remains bullish, we’ll watch for any signs of bearish divergence or reversal patterns, though there are no immediate signs of weakness in the daily structure. The higher timeframes still suggest the trend is intact and healthy.
