BTCUSD| About Current Bullish Momentum and Key LevelsHello there,
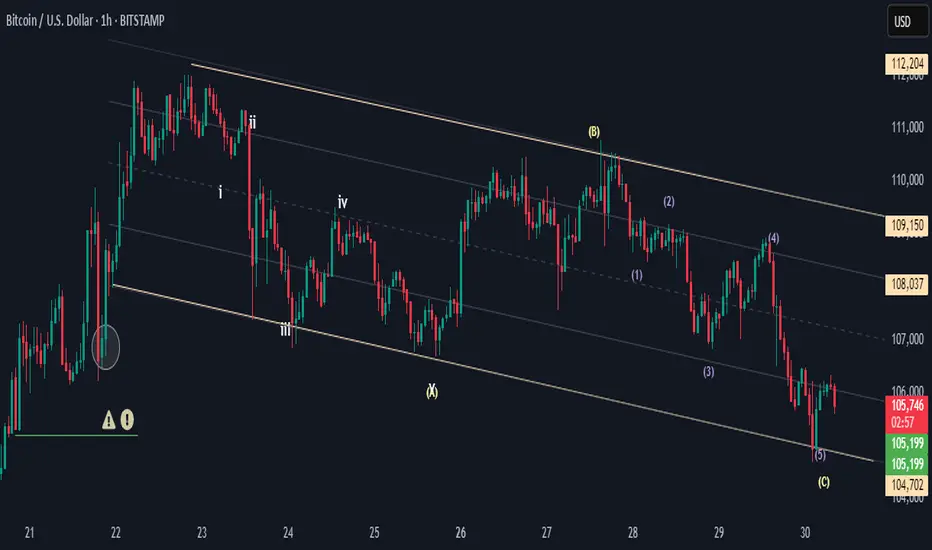
BTCUSD H1—The 105,699 level is currently maintaining bullish momentum; therefore, BTCUSD is in an overall bullish trend on the higher time frame. The price may move up, spike up or down, or break the support line to test another support area below.
For now, the 110,000 level is open, and the 105,199 level is also open.
Happy Trading,
K.
Not trading advice
BTCUSD trade ideas
BTC Breakdown – Reaccumulation at RiskBitcoin just posted a decisive 4H candle close below 55 SMA, mid-Bollinger Band, and the primary ascending trendline. Volume spiked to 7.31M, and RSI dropped to 38, confirming bearish momentum.
⸻
🧩 Wyckoff Structure Under Threat:
• ❌ LPS level invalidated
• ❌ Phase D uptrend broken
• 📉 No breakout above ATH (~109.8K) after three attempts
• 🟠 Still holding BC (Pole End) at ~105.8K
• 🔁 If this breaks next, the entire Phase D/E thesis collapses
⸻
🔻 What’s Next?
• Support:
• S1: Lower BB (~106.9K)
• S2: 105.8K (BC level — key structural base)
• Break of 105.8K = invalidation of reaccumulation, transition into potential distribution. Watch for daily close for confirmation.
• S3: Point of control at 104k
⸻
📊 Breakdown Triggers Confirmed:
• ✅ Close below mid-BB (108.9K)
• ✅ RSI < 45
• ✅ High-volume red candle
• ✅ Structural break of ascending LPS pattern
A short hedge can be initiated with a tight stop over breaking candle high. Note that this could be the shakeout moment i mentioned in my related post.
⸻
Unless BTC recovers 108.5K+ with rising volume quickly, this is now a valid short breakdown, and reaccumulation thesis hangs by a thread.
#Bitcoin #BTCUSDT #Wyckoff #Breakdown #CryptoTA #BTC4H #PriceAction #TechnicalAnalysis

BTC Daily Breakdown – Major Uptrend BreachedBitcoin has now closed below the multi-week ascending trendline on the daily chart — the same trendline that defined the entire Phase D markup structure.
⸻
🔍 Breakdown Highlights:
📉 Daily Close: 107,764 → well below trendline ✅
🔻 Volume: 18.42M (near 20-day average) → not a panic candle, but confirms exit ✅
📉 Fibonacci Cluster: 0.5 (107,093) and 0.618 (105,495) now in play ✅
⚠️ RSI (14): 61.14 → still neutral, but diverging from price ❗
🧱 Next supports:
• 106,146 = BB basis
• 105,821 = BC Pole End
• 104,000 = Point of control from volume profile
⸻
🧩 Structural Impact (Wyckoff View):
• ❌ Trendline break = Phase D invalidated
• ❌ No breakout above ATH (109,852) after 3 attempts
• 🟠 Still not fully invalidated — if 105.8K holds, Spring-like scenario still possible
• 🔻 Close below 105.8K = Phase C fails → transition into Redistribution
⸻
⚠️ What to Watch Next:
• Bounce from 106.1–105.5K with volume could offer one last recovery setup
• A close below 105.8K confirms structural invalidation
⸻
🧠 Final Take:
The trendline break is real. Bulls need to defend the Fibonacci cluster + BC base around 105.8K. If that gives way, this becomes a failed reaccumulation and BTC risks a deeper structural rotation.
#Bitcoin #BTCUSDT #Breakdown #Trendline #TechnicalAnalysis #Wyckoff #BTC #CryptoMarkets #BTCdaily

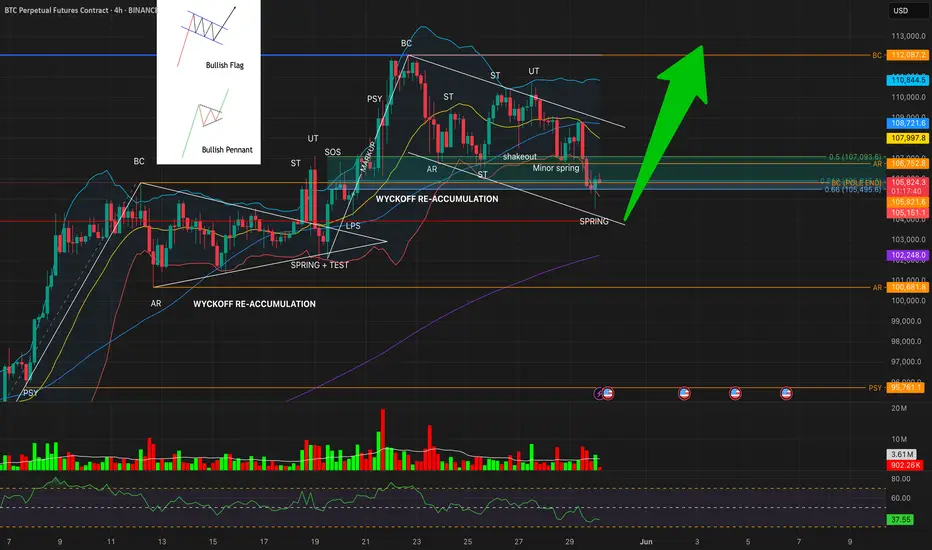
Bitcoin 4H Outlook: Dual Wyckoff Reaccumulation in Play⚙️ Technical Thesis:
We're currently witnessing the unfolding of two back-to-back Wyckoff reaccumulation structures on the 4H timeframe:
📦 Reaccumulation #1 (Left)
Structure: PSY → BC → AR → ST → Spring + Test → LPS → SOS
Bullish pennant formed after Spring, leading to a strong breakout
BC of this phase (105,821) now acts as a major upper resistance
📦 Reaccumulation #2 (Right)
Structure: BC → ST → UT → Shakeout → Minor Spring → SPRING (current)
Current price has tagged Spring at the convergence of:
Lower Bollinger Band ($105,174)
61.8% Fibonacci retracement ($105,915)
🧪 Market Internals
RSI: 38.31 → deeply oversold, aligned with a Spring phase
Volume: Fading on last leg down, hinting exhaustion
BBs:
Upper: $110,828
Basis: $108,006 (confluent with 55 SMA)
Lower: $105,174
200 SMA: $102,248 (macro support)
Pattern context: Another bullish flag is forming within the second structure
🎯 Trade Expectations (Pending Spring Test as Confirmation)
If this Spring holds:
🔄 LPS → Look for bullish reaction with increased volume
TP1: AR retest around $106,752
TP2: 55 SMA + BB Midline confluence at ~$108,000
TP3: Range target or previous BC level near $112,000–$113,000
A decisive break below $105,000 with RSI < 35 and rising volume would invalidate the Spring and shift focus to breakdown risk.
🔍 Wyckoff View
This is a classic Spring setup from a Wyckoff reaccumulation structure. Two sequential structures are visible, and the first structure’s BC now serves as the foundational support for the second. This kind of layered support builds conviction — but needs validation via LPS and SOS phases.
Yes the major trendline was broken, but we are now consolidation and reaccumulation for the next leg up, unless the pattern is invalidated.
🕹 No short setups active unless structural failure confirmed.
💬 Share your view: do you see this as a Spring or potential failure?
#BTCUSDT #Wyckoff #Reaccumulation #CryptoTrading #BitcoinAnalysis #TechnicalAnalysis #Spring #LPS

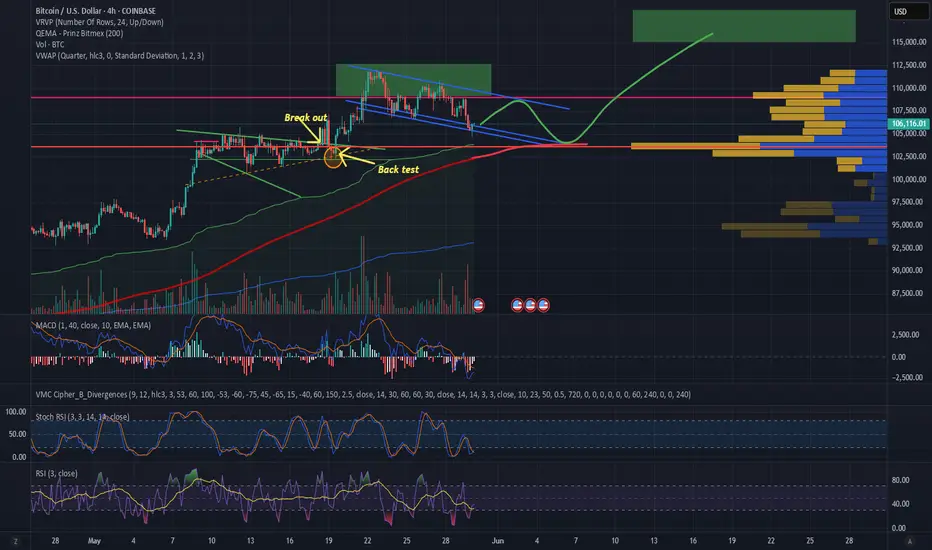
BITCOIN (BTC/USD) – BREAKDOWN FROM THE CHANNEL! WHAT’S NEXT?Hey traders! 🧠
Today’s BTC/USD price action is sending a strong technical signal – price has broken down from the ascending channel, potentially marking the start of a deeper correction. Currently sitting at $106,200, with a daily drop of -1.49%.
🔍 Here’s what I’m seeing:
📉 Uptrend break – bears might be taking control.
🛑 Immediate support: $104,000.
🔼 Resistance ahead: $109,351 – reclaiming this is key for any bullish recovery.
📊 Watching closely whether BTC re-enters the channel or moves toward lower support (~$100K or below).
💡 My current plan:
If $104K holds, we could see a bounce. If not, prepare for a potential deeper dip. A return above $109K would be a bullish sign and could trigger renewed momentum.
📲 Follow me for more real-time updates, trade ideas, and clean technical breakdowns!
👉 If this helped, drop a like – it helps get this analysis in front of more traders!
#Bitcoin #BTCUSD #Crypto #TradingView #TechnicalAnalysis #CryptoTrading

Possibility of uptrend It is expected that a corrective and fluctuating trend will form until the specified time frame. Then there is a possibility of a trend change and the start of an upward trend.
With the breakdown of the support level, the above scenario will be invalidated.

Pitstop for BTCIMO we are just holding support until we continue to what I think could be the last pump.

Bitcoin Sideways Then UpI think we will go sideways and then bounce off the 4hr 200ma as we run up to higher prices, thus continuing the pursuit of price discovery towards $115k-120K +/-. Not financial advice. DYOR.
BTC/USD ssibly initiating a new bearish phase.
Asset: Bitcoin (BTC/USD)
Timeframe: 4-hour (4h)
Platform: TradingView
Price Range: Chart shows BTC trading around $108,998.31
---
🧠 Technical Concepts Used:
🔁 Market Structure Terms:
BOS (Break of Structure):
Located on the left side, indicating a shift in trend direction.
Signifies a strong bearish break, typically following a bullish run, possibly initiating a new bearish phase.
CHOCH (Change of Character):
Mid-chart, near a significant support zone.
Indicates a potential bullish reversal or accumulation phase after a downtrend.
HH/HL (Higher Highs/Higher Lows):
Indicate an uptrend following the CHOCH area.
Bullish market structure forming a channel.
---
🟩 Zones & Targets:
🔲 Support and Resistance Zones:
Support Zone: Marked near the bottom (~$82,000–$85,000 range)
Resistance Zone: Near the top (~$110,000 area), where price currently hovers
🎯 Targets and Forecast:
First Target: Mid-level demand zone around ~$96,000–$98,000
Final Target: Strong demand zone around ~$92,000
Price Path Projection:
Suggests a potential drop from current levels (Red arrow)
Temporary bounce at first target, followed by another drop to final target
Afterwards, a potential bullish retracement or reversal
---
📐 Technical Patterns & Tools:
Trend Channel: Price is moving inside an ascending parallel channel.
Arrow Markings:
Show a forecast of retracement and potential consolidation or reversal.
Liquidity Zones: Highlighted zones suggest institutional interest areas where price may react significantly.
---
📅 Timestamp and Device Info:
Chart Date/Time: Sunday, 25th May 2025, 12:00
Current System Time: 10:21 PM, 27th May 2025
Platform: Dell Laptop with Windows OS
---
✅ Summary Like a Pro:
> "The BTC/USD 4H chart presents a classic smart money setup. Following a break of structure (BOS) and change of character (CHOCH), the price entered a bullish structure forming higher highs. Currently, price action is in a premium zone nearing resistance, suggesting a potential bearish move targeting the first demand zone around $96,000 and final institutional support near $92,000. A corrective retracement is expected before any significant bullish continuation, aligning with key liquidity and order block zones."

BTCUSD Entre point 106000target 107000 stop loss 105200New trade setup for BTCUSD:
- Entry Point: 106,000
- Target: 107,000 (1,000-point gain)
- Stop Loss: 105,200 (800-point risk)
Risk-reward ratio looks decent! Let's see how it plays out. What's your trading strategy behind this setup? Are you expecting a bullish breakout?

BTC WILL CRUSH. BTC ENTRY POINTAs we predicted on our last Analysis BTC exactly reacted and went the direction we wants.
So now if BTC first rejected from 106100-106700, Then we will see a opportunity to go short until 102k. If BTC didn't not respect 106100-106700, And went up with high volume then more likely reject from 107800-108500 above breaker FVG, From there we can go short only if we got rejected.
NOTE: we should wait for the confirmation, The confirmation will be Rejection from those two area.
Analysis: 1H

$BTC Trend Broken - $102k NextThe trend has broken.
₿itcoin respects thy squigglets 🤓
$102k CRYPTOCAP:BTC here we come 🥸
If that doesn't hold, the 200DMA prophecy ~$95k will be fulfilled 🥲

BITCOIN BULLISH TO $116,000 (UPDATE)Bitcoin has come very close to our $116,000 target, within the Crypto Fund for my investors. Price is currently retracing down after peaking at a new ATH of $111,000.
I'll be keeping an eye on market structure & deciding if I should close out early, or hold on a little longer. Always stay adapted to the markets!

BTC Daily Liquidity LevelsBTC Daily Liquidity Levels. Powerful tool to help traders detect and estimate potential price levels where significant liquidation events might occur. By understanding and analyzing these levels, traders can uncover potential support and resistance areas, identify optimal stop-loss levels, and better grasp market sentiment along with possible zones of price volatility.

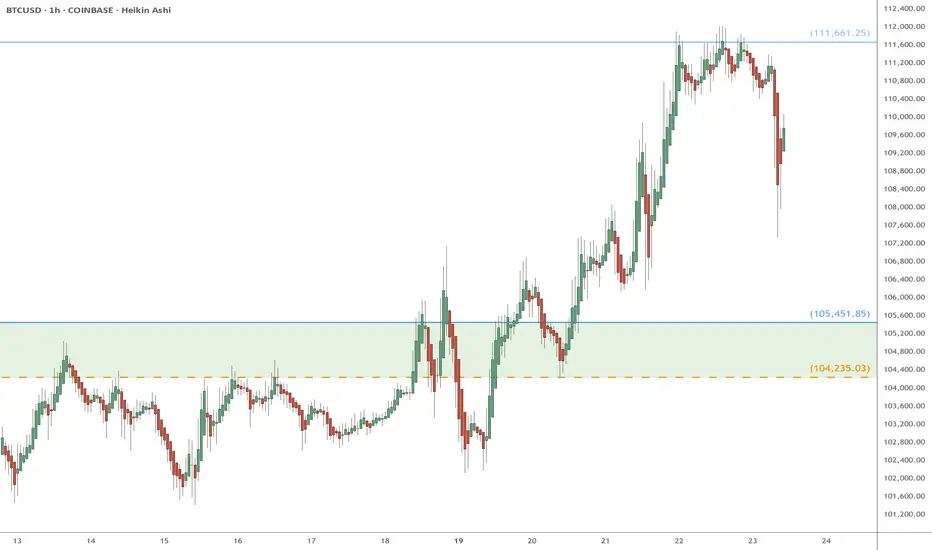
BTC eyes on 104/105k: Near term retrace target that MUST hold Follow up to my bigger picture idea below.
We are retracing from the Genesis fib at 111.7k
It looks like to retest support below at 104/105k
Bulls MUST hold support or "top" will be the word.
.
BTC Big Picture that said WATCH OUT at 111.7k:
===========================================
.
A look at monthly Chart of BTCIf we count Elliot Wave at weekly or monthly, we see we are at the ABC Correction of the Primary Impulsive wave, that the ABC might create an Irregular or Expanded Flat. I think the chart is going to create a C wave of the ABC Primary wave, and those numbers might be a target, but according to Fibbonaci Levels, 0.618, which is 40,000. Other targets can also be seen on the chart.

BITCOIN (BTC/USD) – BREAKDOWN FROM THE CHANNEL! WHAT’S NEXT?Hey traders! 🧠
Today’s BTC/USD price action is sending a strong technical signal – price has broken down from the ascending channel, potentially marking the start of a deeper correction. Currently sitting at $106,200, with a daily drop of -1.49%.
🔍 Here’s what I’m seeing:
📉 Uptrend break – bears might be taking control.
🛑 Immediate support: $104,000.
🔼 Resistance ahead: $109,351 – reclaiming this is key for any bullish recovery.
📊 Watching closely whether BTC re-enters the channel or moves toward lower support (~$100K or below).
💡 My current plan:
If $104K holds, we could see a bounce. If not, prepare for a potential deeper dip. A return above $109K would be a bullish sign and could trigger renewed momentum.
📲 Follow me for more real-time updates, trade ideas, and clean technical breakdowns!
👉 If this helped, drop a like – it helps get this analysis in front of more traders!
#Bitcoin #BTCUSD #Crypto #TradingView #TechnicalAnalysis #CryptoTrading

BTCUSD Technical Analysis.BTC/USD Analysis 🧠📉📈
Price bounced off strong support 💪 at 105K and may target 108.5K 🎯. Bullish reversal expected 🚀.

Inverted Head and Shoulders Pattern Bitcoin first bearish pattern i've seen inverted head and shoulders pattern! $94,000 possible then a run in December! for Bitcoin

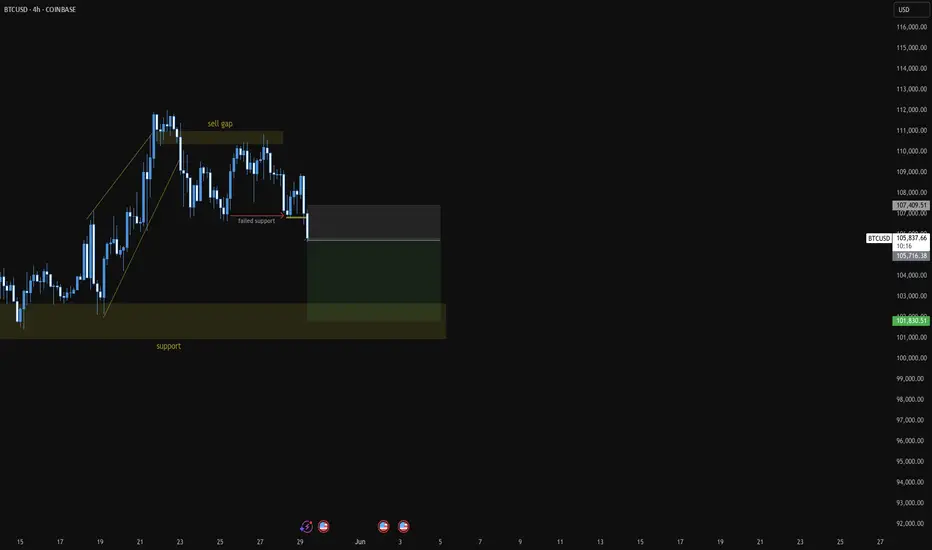
Sell to Bull supportbear pressure is established after the break of TL of the wedge channel. Followed by a strong bear BO that lead to a sell gap. Possible PB after current market made new low.
BTCUSD: About to explode to 135k by July.Bitcoin is about to turn neutral again on its 1D technical outlook (RSI = 57.730, MACD = 3423.900, ADX = 23.501) as it is expreriencing the strongest pullback since the start of its April bottom. Having completed a 1D Golden Cross like on October 27th 2024, this pullback seems a lot like the one that suceeded that Cross, which tested the LH trendline and marginally crossed under it and as it held the 1D MA50, resumed the uptrend and exploded to the 3.382 Fibonacci extension. That is our target on a July horizon (TP = 135,000).
## If you like our free content follow our profile to get more daily ideas. ##
## Comments and likes are greatly appreciated. ##

Bitcoin - Short IDEA - BTCUSDDear traders,
Bitcoin have already broken the bullish trendline, now it is about to go the next level 102$. we will try to get good shorts positions, just wait for the pullbacks to get nice risk rewards.
Best

BTC/USD Testing Resistance Near Downtrend LineBitcoin is currently approaching a descending trendline and horizontal resistance zone around $109,148–$109,177 on the 15-minute chart. Price has shown a steady climb, but is now testing a key level that previously acted as a supply zone.
If price fails to break and close above this level, a potential retracement toward the $107,437 area may follow. The setup displayed on the chart suggests a short-term risk-managed approach, with clearly defined zones for price reaction.
Volume remains steady, and this could be a decision point for bulls and bears in the short term. Watching for confirmation either way.
📌 For educational and charting purposes only.
