Interpreting a Potential Wave 5 in BTC/USDHere's how you can analyze the daily chart of BTC/USD to identify a potential wave 5 uptrend using Elliott Wave Theory:
Confirmation of Uptrend: Analyze the higher timeframe charts (weekly or monthly) to confirm a dominant uptrend.
Completion of Wave 4: Identify the end of the corrective wave 4. It should ideally be shallower than wave 2 and shouldn't breach the bottom of wave 2 in a strong uptrend.
Wave 5 Characteristics: Look for the following signs in the daily chart that might suggest wave 5:
Renewed upward momentum with increased trading volume.
Price surpassing the highs of wave 3, indicating a continuation of the uptrend.
Potential application of Fibonacci extensions, particularly the 1.618 extension applied to wave 3 or the entire wave 1-3 movement, to identify possible price targets for wave 5.
Essential Considerations:
Wave 5 can be deceptive: It might be weaker than anticipated due to profit-taking by earlier trend participants or exhaustion as the trend nears its completion.
False breakouts: Sharp price increases that fail to hold and reverse can trap traders expecting wave 5.
Confirmation is key: Always seek confirmation from other technical indicators like volume analysis, support/resistance levels, and trend indicators before entering a trade.
BTCUSD.P trade ideas

BTC TRIANGLEThere is basically nothing to see on Bitcoin at the moment on higher time frames, so we are forced to zoom in and look for clues.
We have a clear symmetrical triangle, which could be considering a bull pennant. Regardless, the next move will likely be defined by whether price breaks up or down from this triangle.
Still… this is all chop on larger time frames.

BTC update in H4 chart Hello
There is nothing more to say about BTC and please check lest ideas. This is just an update for its new wave counting
Thanks

BITCOIN '' 4 November 2024''When Bitcoin was first introduced by the pseudonymous Satoshi Nakamoto in 2008, it generated a wide range of reactions and predictions from various sectors, including technology enthusiasts, economists, and financial experts. Here are some of the early predictions and opinions about Bitcoin:
1. **Skepticism and Dismissal**:
- Many mainstream financial experts and economists were highly skeptical of Bitcoin. They saw it as a speculative bubble, similar to previous economic bubbles. For instance, economist Nouriel Roubini famously dismissed Bitcoin, predicting its eventual collapse.
- Warren Buffett, a renowned investor, called Bitcoin "rat poison squared" and cautioned investors to stay away from it.
2. **Enthusiasm from Technologists**:
- Among technologists and early adopters, there was significant enthusiasm. They saw Bitcoin as a revolutionary technology with the potential to disrupt the traditional financial system. The decentralized nature of Bitcoin and the underlying blockchain technology were particularly praised.
- Hal Finney, a noted cryptographer, was one of the earliest supporters and received the first Bitcoin transaction from Satoshi Nakamoto.
3. **Libertarian Support**:
- Bitcoin garnered considerable support from libertarians and those advocating for financial privacy and freedom. They viewed Bitcoin as a tool to circumvent government control and provide individuals with greater financial autonomy.
4. **Media Coverage**:
- Early media coverage was a mix of curiosity and skepticism. Some articles highlighted the potential of Bitcoin to change the world, while others focused on its association with illicit activities due to its pseudonymous nature.
5. **Comparison to Gold**:
- Some early proponents referred to Bitcoin as "digital gold," emphasizing its potential as a store of value. This comparison was made due to Bitcoin's limited supply (21 million coins) and its potential to act as a hedge against inflation and economic instability.
6. **Volatility Concerns**:
- Many critics pointed to Bitcoin's extreme volatility as a major drawback, arguing that it would prevent Bitcoin from being used as a stable medium of exchange or store of value.
Here are a few notable early quotes and predictions:
- **Satoshi Nakamoto (2008)**: "I've been working on a new electronic cash system that's fully peer-to-peer, with no trusted third party."
- **Hal Finney (2009)**: "Thinking about how to reduce CO2 emissions from a widespread Bitcoin implementation."
- **Paul Krugman (2013)**: "Bitcoin is evil" - reflecting his strong skepticism and belief that Bitcoin would not succeed.
Despite the mixed predictions and opinions, Bitcoin has grown significantly since its inception, influencing financial markets, inspiring numerous other cryptocurrencies, and sparking widespread interest in blockchain technology.

BTCUSD massive short signals appearbtcusd is trading at the price of67634 today, new month and new week has got triggered some of the strongest sell signals , could this be 32k incomming ,or we could stay in this accumulation zone untill beginning of the bussiness week

Bitcoin cycles since 2011Each crypto cycle lasts about 4 years. The tops and bottoms of these cycles show striking similarities, often following a pattern that has repeated over the years. This isn't just coincidence—there are underlying factors that contribute to this consistency, making it vital to recognize these patterns in your trading strategy.
If history repeats itself, we are looking for this cycle to top around 20 Oct 2025 with next low around 14 Sept 2026.
It will be a wild ride. Buckle up!

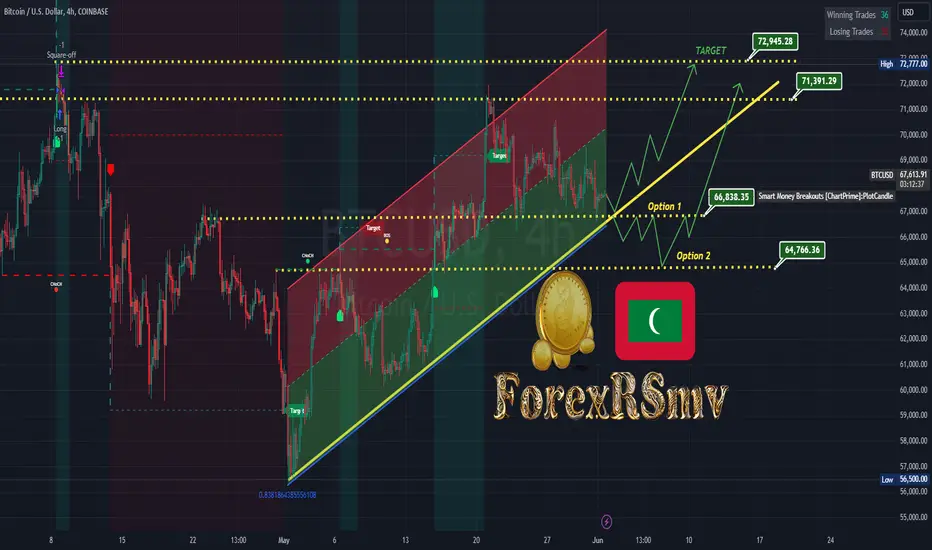
BTCUSD IDEAThe price is still in consolidation.
Now we need to watch for the reaction to the mentioned area :-
(66838-66000-64766 Support ).
If the bulls hold, then the price will head towards the resistance. But, most likely, the market has not yet accumulated the proper potential and the price may go deeper and test the support at 64500 before going up.
But, there is no talk about a crash or a global fall now.
SMART MONEY HIGHLIGHTS Duplicate idea 3, Smart money has tapped their trendline and shows to be moving up. Smart Money contraction is a value line that they also follow.
The green vertical line is a Bank Purchase.
I've retraced their manipulation red and green trendlines.
Trendlines have a little section like a triangle. Zigzag and trendlines have created it.
These red and green trendlines have been retraced from a while back and now I'm showing evidence of their footsteps. You may not agree with my analysis but their footsteps may help you out in your analysis.

Double Top/Double Bottom/Triangle Duplicate idea 3 to show smart money movements. Double top downtrend rejection but later made its move to a fall creating a double bottom. Short position belong to hidden double top.
Smart money green and red trendlines; all I did was retrace and applied to chart which are areas where smart money revisits.
Reads triangle, hoping for a breakout which consists with double bottom.
FYI: since double top is complete; trend may go sideways or make its way up. Hidden double tops have gone down as low as 2.29%. Target is at 2%.

BTCUSD SMALL RISK ENTRYI cancelled the previous short position and put a limit on the chart above. Just my own analysis
TYOR!!!

BTC SHORTThe London open rejected the FVG formed during the Asian session at 8am. Look out for bulls, the zone still remains unfilled, and may be potentially filled during the day.

Mother of all Cup & Handles forming? I feel we could see a bigger drop in the next 40 days before the halving. This would be in line with the drops we've seen before every other halving.

WHALES LOW VOLUME IS NOW HERE! (Whales have arrived)Today, whales low volume on a 1Day TF has appeared. I told ya it was pending process and now shows complete at 5pm pacific time as of today.
View my vertical lines, each one represents 1Day TF from the start when whales low volume was complete. Ended weeks later.
Next 1DAY TF vertical line took days to complete. View each smart money contraction value lines then follow the trend.
When have I mentioned whales low volume and failed?
Who’s ready for another BULL RUN? I added possible targets. Next move is to wait for WHALES to buy some huge BTC.

BTC price will be lower at 20h45 tomorrow than price today Price tomorrow will be lower at 20h45 than today at same time.

BTCUSD BUYMarket sweeps PDL with strong displacement to the up side with MSS and IMB and breaker entry at the 50% of IMB and target 1:2RRR lets see how it goes

BTC consolidates to 20 EMABTC is slowly grinding down to the 20 EMA here, in a bullish trend the 20 is usually held. The stochastic RSI has now bottomed on the daily but is still pointing upward on the weekly from a recent bottom, this is bullish for expansion. New all time highs did not come in May, but I do think June presents an opportunity, June historically is one of BTCs best months statistically. I think we see 78-79k this month based on those stats and the upholding bullishness. Buyers have been stepping in at these levels. A flush back to 66k flat would align perfectly with the 50 EMA and the bases and tops of the candles I marked with the red ray.

BTCUSD is clearing its way for bullish to reach $73000.00.BTCUSD is clearing its way for bullish to reach $73000.00. BITSTAMP:BTCUSD
BTCUSD is expected to reach $73000.00 as per the technical analysis for BTCUSD Futures Contract (May 2024) and Bitcoin (BITSTAMP:BTCUSD) as of May 1, 2024. The analysis uses indicators such as Moving Averages, Oscillators, and Pivots. Key indicators include Relative Strength Index (RSI), Stochastic %K, Commodity Channel Index (CCI), Average Directional Index (ADX), Awesome Oscillator, Momentum, MACD Level, Stochastic RSI Fast, Williams Percent Range, Bull Bear Power, and Ultimate Oscillator. Moving Averages are not specified, and the information provided is not personalized investment advice. It is recommended to conduct research and consider risk tolerance before making any trading decisions. BITSTAMP:BTCUSD
BITSTAMP:BTCUSD LIKE👍, COMMENT 💬 & FOLLOW ➕, these figures can encourage me to analyze more efficiently for you. My all followers are requested to support me, comment my ideas and share your thoughts in comment box and new comers are invited to follow and support me.

BTCUSD Short (Sell Stop)
Enty : 67587
TP : 61675 (5912 pts)
SL : 69065 (1478 pts)
TF : 4H
RR : 1:4
Estimate PnL :
| Lot | Max TP| Max SL
|0.01| $59.12 | -$14.78
|0.02|$118.24| -$29.56
|0.03|$177.36| -$44.34
|0.04|$236.48| -$59.12
|0.05|$295.60| -$73.90
Expire : June, 08th 2024 (15:00 GMT+7)
Warning : This analysis is not trading advice. Always do your own research and manage your financial risk.

Spotting Bitcoin Bargains: Key Price Levels for Savvy InvestorsThe ever-volatile world of Bitcoin can be daunting for investors, especially when it comes to pinpointing the right moment to buy.
The $66,000 Threshold: A Potential Re-Test and Buying Zone
If the price dips below the $66000 level, it could trigger a further decline, potentially reaching the lower range of its recent consolidation period. This scenario, however, presents a prime opportunity for investors to accumulate Bitcoin at a potentially discounted price.
Beyond $66,000: $61,000 as Another Possible Entry Point
Analysts state Bitcoin could slide further, potentially reaching $61,000. This price point could represent another significant entry point for investors seeking to add Bitcoin to their portfolios.
By closely monitoring these price levels, particularly the potential support zones around $66,000 and $61,000, investors can potentially capitalize on market dips and acquire Bitcoin at a potentially lower cost. However, it's crucial to remember that these are just potential entry points, and the market can be unpredictable.
Dollar-Cost Averaging (DCA): A Sensible Strategy for Volatile Markets
While strategic buying based on price zones can be tempting, analysts advocates for a strategy called Dollar-Cost Averaging (DCA) during volatile periods. DCA involves investing a fixed amount of money into Bitcoin at regular intervals, regardless of the current price. This approach aims to average out the cost per Bitcoin over time, mitigating the risk of buying at a peak.
DCA is a prudent strategy, especially for those new to the cryptocurrency market or those who prefer a less hands-on approach. It removes the emotional element from investing and encourages a disciplined, long-term perspective.
Beyond Price Points: Additional Considerations for Bitcoin Investors
While price levels are a significant factor, they shouldn't be the sole consideration when buying Bitcoin. Investors should also consider the following:
• Overall market trends: Analyze the broader market sentiment and identify any potential bullish or bearish signals.
• Technical analysis: Utilize technical indicators to gain insights into potential support and resistance levels.
• Fundamental analysis: Evaluate the underlying factors driving the value of Bitcoin, such as adoption rate, regulations, and upcoming developments.
• Risk tolerance: Be honest about your risk tolerance and invest only what you can afford to lose.
The Final Word: Strategic Buying and a Long-Term Vision
Strategic buying based on price zones can be a valuable tool for investors seeking to maximize their returns on Bitcoin. However, it's crucial to combine this approach with a well-rounded investment strategy that considers market trends, technical analysis, and fundamental factors. Additionally, adopting a Dollar-Cost Averaging strategy can be a sensible way to navigate volatility and build a Bitcoin position over time.
Remember, Bitcoin is a highly volatile asset, and there's no guaranteed path to success. By combining strategic buying with a long-term vision and a well-defined risk management plan, investors can potentially increase their chances of profiting in the dynamic world of Bitcoin.

BTCUSD Uptrend is strong: 100k+ is imminentBTCUSD is holding key golden fib resistance during this uptrend since October 2023. 2W Heiken Ashi doji just printed as well, similar pattern as earlier in januar 2024.
We are going much higher, 100k is just the first stop.


Bitcoin gets rejected for the second timeAfter falling below $67,000 last week, Bitcoin (BTCUSD) recovered much of the losses over the weekend and yesterday. Nevertheless, the rally stopped at the descending channel’s upper bound, and Bitcoin retreated lower. Currently, it trades near the $68,000 mark, and the short-term bullish trend is losing momentum. Accordingly, our focus remains on the resistance at $70,000 and support at $66,343.
Illustration 1.01
The daily chart of Bitcoin (BTCUSD) above shows the descending channel. Two yellow arrows indicate rejections at its upper bound, which are slightly bearish.
Illustration 1.02
The 4-hour Bitcoin (BTCUSD) chart above shows the ascending channel within the bigger descending channel, which can be used to observe the trend of a lesser degree; a price breakdown at its lower bound would bolster a bearish case.
Technical conditions
Daily time frame = Slightly bullish (turning neutral)
Weekly time frame = Bullish (losing momentum)
Monthly time frame = Bullish
Bitcoin addresses
The number of Bitcoin addresses with balances exceeding 1,000 BTC has not changed dramatically since our previous update. In fact, the figure is near a 3-month high, suggesting big speculators are not liquidating their positions despite steep price tags. Similarly, there was no significant change in the number of addresses with balances exceeding 100 BTC.
Please feel free to express your ideas and thoughts in the comment section.
DISCLAIMER: This analysis is not intended to encourage any buying or selling of any particular securities. Furthermore, it should not serve as a basis for taking any trade action by an individual investor or any other entity. Your own due diligence is highly advised before entering a trade.

Double Tap on the Resistance (Almost) No One is Talking About.. So here we are again, and most are still barely paying attention to this resistance level..
I was right about the first rejection here so lets see if we can make it 2/2..
Could that double tap finally signal the beginning of the real sell off?
BTC has lost that Green dotted support line and is in the process of retesting it as I type this.
Lets see what happens, but this would make for a REALLY bad time for traditional markets to sell off.. 😬
Right shoulder down to my Buy Zone incoming?
