Trendline Breakout Strategy NILKAMAL:- The stock has tried to provide the TRENDLINE BREAKOUT in daily time frame. Keep an eye on the stock.
Next report date
—
Report period
—
EPS estimate
—
Revenue estimate
—
81.90INR
1.22 BINR
31.96 BINR
4.90 M
About NILKAMAL LTD
Sector
Industry
Headquarters
Mumbai
Website
Founded
1985
ISIN
INE310A01015
FIGI
BBG000CX3TX0
Nilkamal Ltd. is a holding company, which engages in the manufacture and sale of plastic crates and moulded furniture. It operates through the following segments: Plastics and Lifestyle Furniture, Furnishings & Accessories segments. The company was founded by Vamanrai Vrajlal Parekh and Sharad Vrajlal Parekh on December 5, 1985 and is headquartered in Mumbai, India.

Inverted head and shoulder This stock formed inverted head and shoulder. Volume check in comming days

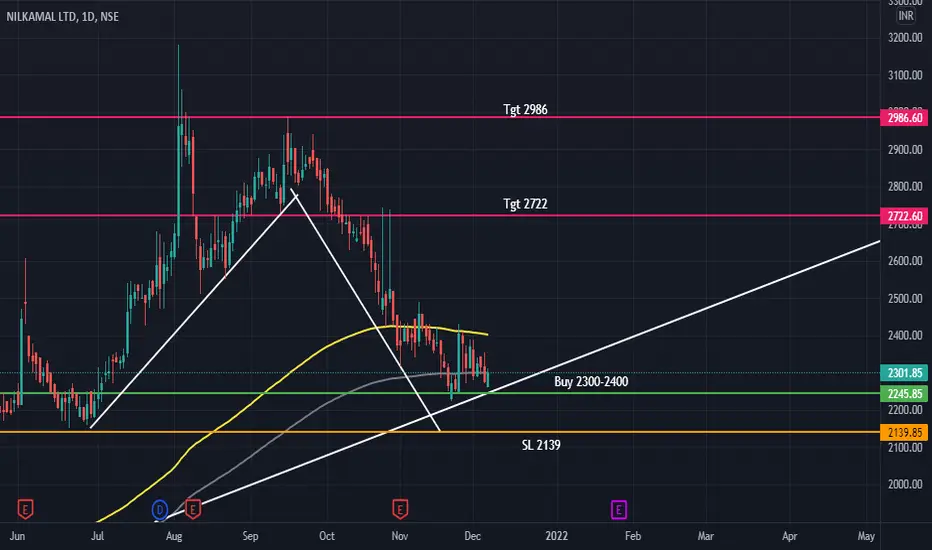
NILKAMAL (LONG)please see the previous chart of nilkamal all levels are marked on it.
Buy near 2300 - 2400
SL 2139
TGT 2722 - 2986
Please Correlate by yourself also on charts. This is for Educational and Paper Trading Purpose Only. Must Consult your financial advisor before Investing.
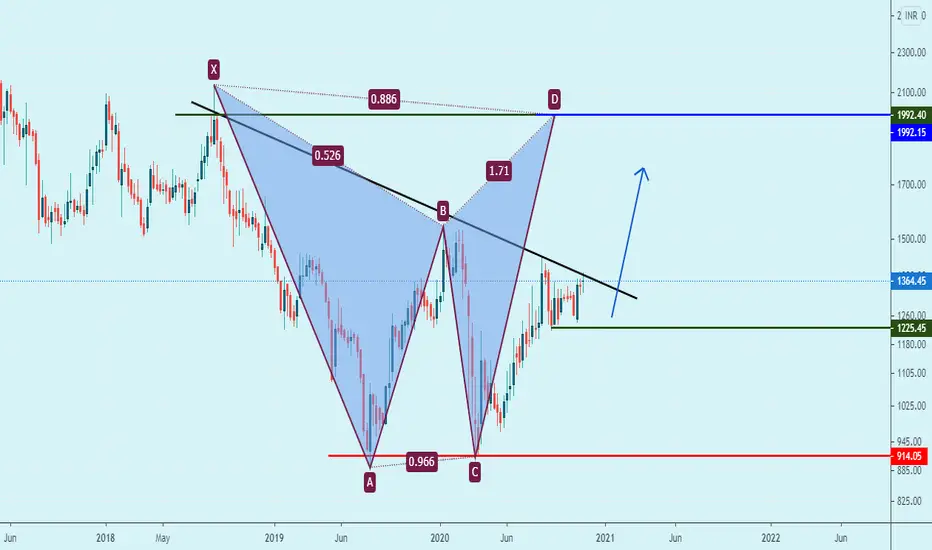
Nilkamal (Long)Tgt --- SL --- Buy price as given on the chart.
Nilkamal took support and ready to fly now
Please Correlate yourself also on charts. This is for educational purpose only. Must consult your financial advisor before investing.


NILKAMALNSE:NILKAMAL
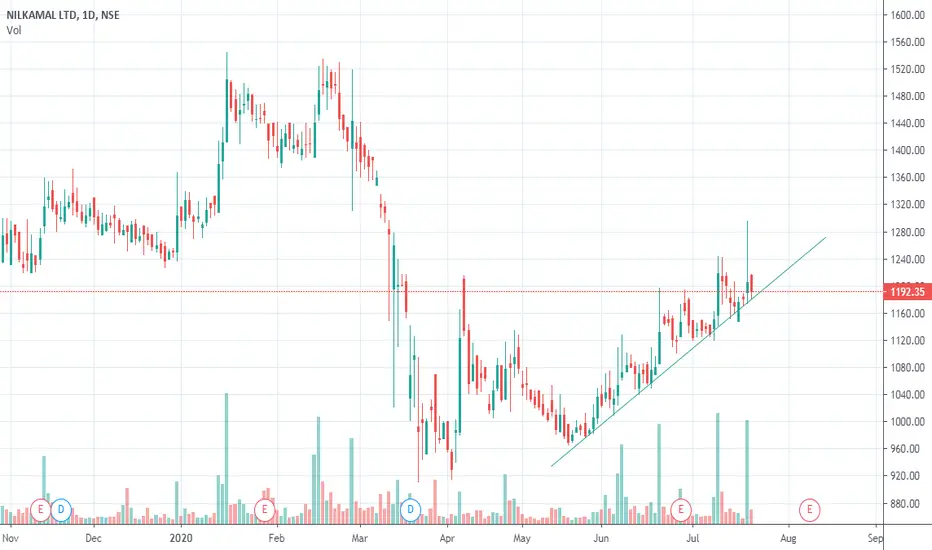
The pattern looks good on charts with good Higher high and Higher lows in last few days, it can be a buy with stop loss of 1140-1135 for a target of 1240 and 1330.
*******************************************************************************************************************
See all ideas
Trade directly on the supercharts through our supported, fully-verified and user-reviewed brokers.


Frequently Asked Questions
The current price of NILKAMAL is 1874.25 INR — it has decreased by 1.18% in the past 24 hours. Watch NILKAMAL LTD. stock price performance more closely on the chart.
Depending on the exchange, the stock ticker may vary. For instance, on BSE exchange NILKAMAL LTD. stocks are traded under the ticker NILKAMAL.
NILKAMAL stock has risen by 1.88% compared to the previous week, the month change is a 0.14% rise, over the last year NILKAMAL LTD. has showed a 22.17% decrease.
We've gathered analysts' opinions on NILKAMAL LTD. future price: according to them, NILKAMAL price has a max estimate of 2116.00 INR and a min estimate of 2116.00 INR. Watch NILKAMAL chart and read a more detailed NILKAMAL LTD. stock forecast: see what analysts think of NILKAMAL LTD. and suggest that you do with its stocks.
NILKAMAL reached its all-time high on Aug 3, 2021 with the price of 3174.00 INR, and its all-time low was 34.45 INR and was reached on Oct 30, 2003. View more price dynamics on NILKAMAL chart.
See other stocks reaching their highest and lowest prices.
See other stocks reaching their highest and lowest prices.
NILKAMAL stock is 1.96% volatile and has beta coefficient of 0.90. Track NILKAMAL LTD. stock price on the chart and check out the list of the most volatile stocks — is NILKAMAL LTD. there?
Today NILKAMAL LTD. has the market capitalization of 28.30 B, it has decreased by 2.17% over the last week.
Yes, you can track NILKAMAL LTD. financials in yearly and quarterly reports right on TradingView.
NILKAMAL LTD. is going to release the next earnings report on Aug 2, 2024. Keep track of upcoming events with our Earnings Calendar.
NILKAMAL net income for the last quarter is 355.06 M INR, while the quarter before that showed 293.01 M INR of net income which accounts for 21.18% change. Track more NILKAMAL LTD. financial stats to get the full picture.
Yes, NILKAMAL dividends are paid annually. The last dividend per share was 20.00 INR. As of today, Dividend Yield (TTM)% is 1.05%. Tracking NILKAMAL LTD. dividends might help you take more informed decisions.
NILKAMAL LTD. dividend yield was 1.17% in 2023, and payout ratio reached 24.41%. The year before the numbers were 1.14% and 22.28% correspondingly. See high-dividend stocks and find more opportunities for your portfolio.
EBITDA measures a company's operating performance, its growth signifies an improvement in the efficiency of a company. NILKAMAL LTD. EBITDA is 2.90 B INR, and current EBITDA margin is 9.09%. See more stats in NILKAMAL LTD. financial statements.
Like other stocks, NILKAMAL shares are traded on stock exchanges, e.g. Nasdaq, Nyse, Euronext, and the easiest way to buy them is through an online stock broker. To do this, you need to open an account and follow a broker's procedures, then start trading. You can trade NILKAMAL LTD. stock right from TradingView charts — choose your broker and connect to your account.
Investing in stocks requires a comprehensive research: you should carefully study all the available data, e.g. company's financials, related news, and its technical analysis. So NILKAMAL LTD. technincal analysis shows the sell today, and its 1 week rating is sell. Since market conditions are prone to changes, it's worth looking a bit further into the future — according to the 1 month rating NILKAMAL LTD. stock shows the sell signal. See more of NILKAMAL LTD. technicals for a more comprehensive analysis.
If you're still not sure, try looking for inspiration in our curated watchlists.
If you're still not sure, try looking for inspiration in our curated watchlists.