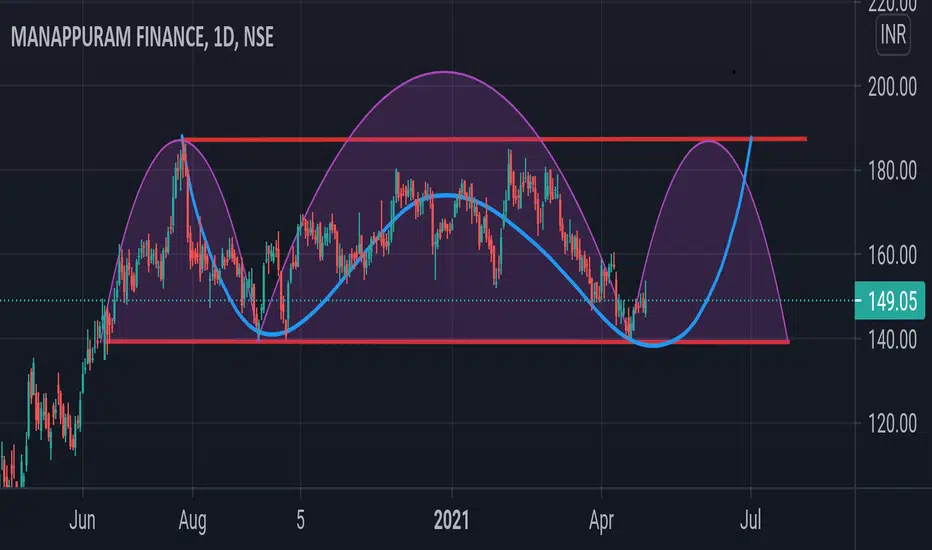
manapuram finance broke out manapuram finance broke out from previous ressitance
taken resteest pull back
CPR of weekly time frame is very tight it seems have potential to rise
MANAPPURAM trade ideas

MANAPPURAM FINANCE: CMP:173. It crossed 200 EMA and good in voluGo for buy with keeping stoploss at 165. target is 184 to 186.
Disclamer:Please check with your financial adviser before taking any trade and also put your own analysis.

Manappuram upside move maybe startHello..
Manappuram has break his trand line.... So NAJAR MAI RKHHO ESKO..

BUY #MANAPPURAM STOCK PRICE @ 195.45 RS 38% ROI EXPECTEDBUY #MANAPPURAM STOCK PRICE @ 195.45 RS 38% ROI EXPECTED
Buy Entry @ 195.45
Target @ 269.0
Our Unique Features:
—————————————————————
1. Follow our 15 signals ….10% equity will increase in your account for sure.
2. We are not Trailing stop! or average the trades.
3. 2% Risk Management Per trade.
4. Risk vs Reward up to 1:7.
Note:
Trade signals would usually have a risk to reward ratio of 1:2.
It means that even 2 out of 4 signals hits their SL marks, the other two would have closed with profit.
This allows you to be good in overall pips profit.
Signals are usually inter-day (Based on the daily candle) therefore, trades would usually have a holding time of an average minimum of 24 hours.
Note: Everything works with Best money management.
Note: Please leave comments for any query.
Disclaimer: This is my trading experience, it is not an invite or recommendation to trade.
Best Wishes
Tradingwithtamil


manapuramit has given a break out from its range with good volumes
i will let it retrace to 195 and if there are bullish confirmation
at 195 i will start accumulate it

Manappuram FinanceWeekly breakout seen in the same.
Positional call
Target 265
Stop loss - 175
Only for educational purposes.

Manappuram Finance Long TradeManappuram Finance is breaking out the resistance level of many months on daily time frame basis. For both trading and investing it is considered as good setup. For trading purpose we shall enter our trade at LTP with a fixed stop loss of 15 points against the target of 40 points.
(Note:- This is my personal views. Please consult with your financial advisor before taking trade.)


CUP AND HANDLE PATTERN IN MANAPURRAM RSI 65, VOLUME BREAKOUT, RESISTANCE BREAKOUT ... EXPECTED TARGET OF 10-11 PERCENT IN SWING TRADE

Manappuram - Bearish Shark at DailyManappuram has bearish shark at daily Time frame. Target and cypher forecast on chart...


MANNAPPURAM FINANCE Daily Confluence of Weekly & Daily Bearish Bat strong potential reversal zones
Waiting for Break of Trend line with RSI BELOW 70
Sell

MANNAPPURAM FINANCE BEARISH BAT STRONG PRZ
Withiin 3-5 price bars PATTERN need to be get confirmed from a BEARISH CANDLE with RSI Below 70
POTENTIAL SELL

Clear Sign for Long.RSI Showing strength on Daily Charts & Weekly, Good Base formation, Long entry for target 180+ happy trading.

Manapurram Finance- Dragon Fly Doji Bullish CandleManapurram Finance- Dragon Fly Doji Bullish Candle


Manappuram finManappuram looks good if it holds 135 (stoploss) Targets-160,187 (hldng period 1mnth) ,forming Head and shoulders pattern ,Parallelchannel pattern ,Harmonicpattern
As on can see th formation of multiple chart patterns which are not quite often so check it and learn from it
MANAPPURAM FINANCE
All the key levels are mentioned in chart with Stop-loss and Targets
Disclaimer
I am not sebi registered analyst
My studies are Educational purpose only
Please consult with your Financial advisor before trading or investing

MANAPPURAM @Buy 140 to 146 Demand Zone MANAPPURAM @Buy 140 to 146 Demand Zone Once again ready and traded our demand zone area, for investment i believe 5 times target easily...


Daily dynamic zone TJK//Average Daily Range Levels - 10 day
study(title="Dynamic Zone - Daily", shorttitle=" Dynamic Zone - Daily ", overlay=true)
//dayHigh=security(tickerid, 'D', high )
OPEN=security(tickerid, 'D', open)
//ADR L
dayrange=(high - low)
r1 = security(tickerid, 'D', dayrange )
r2 = security(tickerid, 'D', dayrange )
r3 = security(tickerid, 'D', dayrange )
r4= security(tickerid, 'D', dayrange )
r5= security(tickerid, 'D', dayrange )
r6 = security(tickerid, 'D', dayrange )
r7 = security(tickerid, 'D', dayrange )
r8 = security(tickerid, 'D', dayrange )
r9= security(tickerid, 'D', dayrange )
r10= security(tickerid, 'D', dayrange )
adr_10 = (r1+r2+r3+r4+r5+r6+r7+r8+r9+r10) /10
adr_9 = (r1+r2+r3+r4+r5+r6+r7+r8+r9) /9
adr_8 = (r1+r2+r3+r4+r5+r6+r7+r8) /8
adr_7 = (r1+r2+r3+r4+r5+r6+r7) /7
adr_6 = (r1+r2+r3+r4+r5+r6) /6
adr_5 = (r1+r2+r3+r4+r5) /5
adr_4 = (r1+r2+r3+r4) /4
adr_3 = (r1+r2+r3) /3
adr_2= (r1+r2)/2
adr_1 = r1
//plot
adrhigh10=plot((OPEN+(adr_10/2)) , title="ADR High10",style=circles,color=red,linewidth=2)
adrlow10=plot((OPEN-(adr_10/2)), title="ADR LOW10",style=circles, color=green,linewidth=2)
//adrhigh9=plot((OPEN+(adr_9/2)) , title="ADR High9",style=circles,color=red,linewidth=2)
//adrlow9=plot((OPEN-(adr_9/2)), title="ADR LOW9",style=circles, color=green,linewidth=2)
//adrhigh8=plot((OPEN+(adr_8/2)) , title="ADR High8",style=circles,color=red,linewidth=2)
//adrlow8=plot((OPEN-(adr_8/2)), title="ADR LOW8",style=circles, color=green,linewidth=2)
//adrhigh7=plot((OPEN+(adr_7/2)) , title="ADR High7",style=circles,color=red,linewidth=2)
//adrlow7=plot((OPEN-(adr_7/2)), title="ADR LOW7",style=circles, color=green,linewidth=2)
//adrhigh6=plot((OPEN+(adr_6/2)) , title="ADR High6",style=circles,color=red,linewidth=2)
//adrlow6=plot((OPEN-(adr_6/2)), title="ADR LOW6",style=circles, color=green,linewidth=2)
adrhigh5=plot((OPEN+(adr_5/2)) , title="ADR High5",style=circles,color=red,linewidth=2)
adrlow5=plot((OPEN-(adr_5/2)), title="ADR LOW5",style=circles, color=green,linewidth=2)
//adrhigh4=plot((OPEN+(adr_4/2)) , title="ADR High4",style=circles,color=red,linewidth=2)
//adrlow4=plot((OPEN-(adr_4/2)), title="ADR LOW4",style=circles, color=green,linewidth=2)
//adrhigh3=plot((OPEN+(adr_3/2)) , title="ADR High3",style=circles,color=red,linewidth=2)
//adrlow3=plot((OPEN-(adr_3/2)), title="ADR LOW3",style=circles, color=green,linewidth=2)
//adrhigh2=plot((OPEN+(adr_2/2)) , title="ADR High2",style=circles,color=red,linewidth=2)
//adrlow2=plot((OPEN-(adr_2/2)), title="ADR LOW2",style=circles, color=green,linewidth=2)
//adrhigh1=plot((OPEN+(adr_1/2)) , title="ADR High1",style=circles,color=red,linewidth=2)
//adrlow1=plot((OPEN-(adr_1/2)), title="ADR LOW1",style=circles, color=green,linewidth=2)
fill(adrlow10,adrlow5,color=lime)
fill(adrhigh10,adrhigh5,color=maroon)
//fill(adrlow2,adrlow9,color=lime)
//fill(adrhigh2,adrhigh9,color=maroon)
//fill(adrlow3,adrlow8,color=lime)
//fill(adrhigh3,adrhigh8,color=maroon)
//fill(adrlow4,adrlow7,color=lime)
//fill(adrhigh4,adrhigh7,color=maroon)
//fill(adrlow6,adrlow2,color=lime)
//fill(adrhigh6,adrhigh2,color=maroon)

