Keep an eye on the #BNB/USDT Diagonal Trendline in 4-Hour TF!Keep an eye on the #BNB/USDT Diagonal Trendline in 4-Hour TF!
Wait for BO to open a long position. The local resistance level is PMH $632.2.
BNBUSDT trade ideas

Trading Signal For BNBUSDT BinanceCoin Trading Setup:
There is a Trading Signal to Sell in BNBUSDT BinanceCoin
Traders can open their Sell Trades NOW
⬇️ Sell now or sell on 603.6
⭕️SL @ SL: 613.6
🔵TP1 @ 566.0
🔵TP2 @ 542.0
🔵TP3 @ 509.5
What are these signals based on?
Classical Technical Analysis
Price Action Candlesticks Fibonacci
RSI, Moving Average , Ichimoku , Bollinger Bands
Risk Warning
Trading Forex, CFDs, Crypto, Futures, and Stocks involve a risk of loss. Please consider carefully if such trading is appropriate for you. Past performance is not indicative of future results.
If you liked our ideas, please support us with your likes 👍 and comments .

Lingrid | BNBUSDT trend CONTINUATIONBINANCE:BNBUSDT recently broke the key resistance level at 600. The market is probably going to consolidate below the strong resistance and then break through. However, on the 4H timeframe, the market was moving sideways. It broke the top of the range, then retested it, indicating potential trend continuation. On the weekly timeframe, the market formed a massive long-tailed bar, which shows buying pressure. If the market breaks the previous week's high, then we might have a bull run. My goal is resistance zone 615 - 620
Traders, if you liked this idea or if you have your own opinion about it, write in the comments. I will be glad 👩💻

BNB UP to 830 or 850 rangeSymmetrical Triangle pattern clear on one day chart BNB, rising to 830 USD or 850 USD

$BNB is forming a beautiful triangleCRYPTOCAP:BNB is forming a beautiful triangle
I inicially thought it would form a parallel channel, but no, as you can see the channel is still on chart (in yellow)
Breakout from this triangle will give us 27% from today price
Expect some more downtrend for a few days before the breakout, as the Detonator indicator (purple) is riding on top of oscilation

BNBUSDT IDEAHello Trading view Family / Fellow Traders.
I hope you have used and benifited from the previous analysis .
In today trading session we are monitoring BNBUSDT for a buying opportunity,
BNBUSDT UPDATE
Formation of the Ascending triangle Pattern in 1D timeframe✴️
Breakout may lead 20-25% increase in price💸✅

Will BNB maintain current resistance?Hello everyone, let's look at the 4H BNB to USDT chart, in this situation we can see how the price is moving in a sideways trend channel, staying below the local downtrend line.
Let's start by setting goals for the near future that we can include:
T1 = USD 579.2 at which the price struggles
T2 = $605.9
T3 = $623.6
AND
T4 = $648.3
Now let's move on to the stop-loss in case of further market declines:
SL1 = $570.1
SL2 = $539.4
SL3 = $518.2
AND
SL4 = $491.50
Looking at the RSI indicator, we can see that there is still room for price movement down, but when we look at the STOCH indicator, we can see that it has returned to the lower border of the channel, which may slow down the price decline.

The profit of fluctuation ---- BNBAfter the Federal Reserve slowed its balance sheet reduction and the labor market cooled more than expected, BTC led the token rebound. Compared with the dump that the token experienced in April, the price of BNB has always remained at a high level. This is related to Binance’s frequent Launchpad and Megadrop launches. The logical upper limit of BNB fundamentals is based on Binance’s activity, and the logical lower limit is based on the SEC’s actions against Binance.
We have previously analyzed BNB based on the TSB indicator, and we can see that the wavy area still plays a role, and BNB maintains a bullish trend at the daily level. If you used the TSB indicator and opened a long position, then hold on to it.
If you missed the TSB indicator, let's take a look at the effect of the KDMM indicator on BNB. Switching to the 4h level, we can see that BNB has clearly entered a fluctuation trend. This is a necessary conditions for using the KDMM indicator. When everything is satisfied, you only need to wait for the value on the KDMM indicator to reach a high (80) for the bearish momentum to increase or for the value to reach (20) for the bullish momentum to increase. Then carry out bearish and bullish operations accordingly. We have marked the clear signal locations on the indicator area with red and green lines. This can help you profit during fluctuation.
Introduction to indicators:
Trend Sentinel Barrier (TSB) is a trend indicator, using AI algorithm to calculate the cumulative trading volume of bulls and bears, identify trend direction and opportunities, and calculate short-term average cost in combination with changes of turnover ratio in multi-period trends, so as to grasp the profit from the trend more effectively without being cheated.
KDMM (KD Momentum Matrix) is not only a momentum indicator, but also a short-term indicator. It divides the movement of the candle into long and short term trends, as well as bullish and bearish momentum. It identifies the points where the bullish and bearish momentum increases and weakens, and effectively capture profits.
Disclaimer: Nothing in the script constitutes investment advice. The script objectively expounded the market situation and should not be construed as an offer to sell or an invitation to buy any cryptocurrencies.
Any decisions made based on the information contained in the script are your sole responsibility. Any investments made or to be made shall be with your independent analyses based on your financial situation and objectives.

BNBUSDT IDEAHello Traders Hope You Are Enjoying Our Analysis. Today We Will Discuss About BNB
(Update)
On The Verge Of Massive Breakout In 1D Timeframe⚡️
In Case Of Successful Breakout Expecting Massive Bullish Rally✍️

Binance Coin BNB Intraday Trade SetupBinance Coin is in the bullish territory in the H4 chart.
A bullish break-out of $603 will offer more upside towards $619 where the price action will be key.
A re-test of $590 followed by a bullish rejection will lead to a bullish move towards $619 and, possibly, higher to $646-$658.
An inability to sustain price action above $590 will result in a range-bound price action towards $577 and lower to $565, the key intraday support.
Find more info in signature.

Binance Coin can rebound up from support line to 561 pointsHello traders, I want share with you my opinion about Binance Coin. By observing the chart, we can see that the price some time ago started to decline inside the downward channel, where it reached the resistance line at once, and then rebounded down to the support line of the downward channel. Later, the price bounced up from this line and rose to the seller zone, which coincided with the resistance level, but soon turned around and fell lower this level, breaking it. After this, BNB reached the 600 level and then made impulse down to 539 points, thereby exiting from the downward channel, breaking the support level, which coincided with the buyer zone and entered to upward wedge. In this pattern, the price soon broke the 561 level again and in a short time later rose to the resistance line of the wedge, which coincided with the resistance level, but at once rebounded and fell to the support line. A few moments ago, the price bounced from this line and now I think that Binance Coin can correct to the support line and then rebound up to the resistance line of the wedge, thereby breaking the resistance level. So, for this case, I set my target at 561 points. Please share this idea with your friends and click Boost 🚀

$BNBUSDT is Ready for Bullish Rally Dear Respected Traders, we hope this communication finds you well.
we are convening a discussion focused on #BNBUSDT
On The 10H Time Frame📊:
The Bullish Pennant Pattern is Formed , Now it's Ready to Break the Pattern
In Case of Successful Breakout, Expecting a Bullish Move of 40-50% 🚀
#Bitcoin #Crypto #Ethereum #Cryptocurrency #CryptoTrading #BTCUSDT #ETHUSDT #ALTCONS #USDT CRYPTOCAP:BTC CRYPTOCAP:ETH CRYPTOCAP:USDT

$BNBUSDT UPDATEDear Respected Traders, we hope this communication finds you well.
we are convening a discussion focused on BNB
#BNBUSDT is on a support level in the 4 hr time frame.
Soon we will see a bullish move of 70%
#Bitcoin #Crypto #Ethereum #Cryptocurrency #CryptoTrading

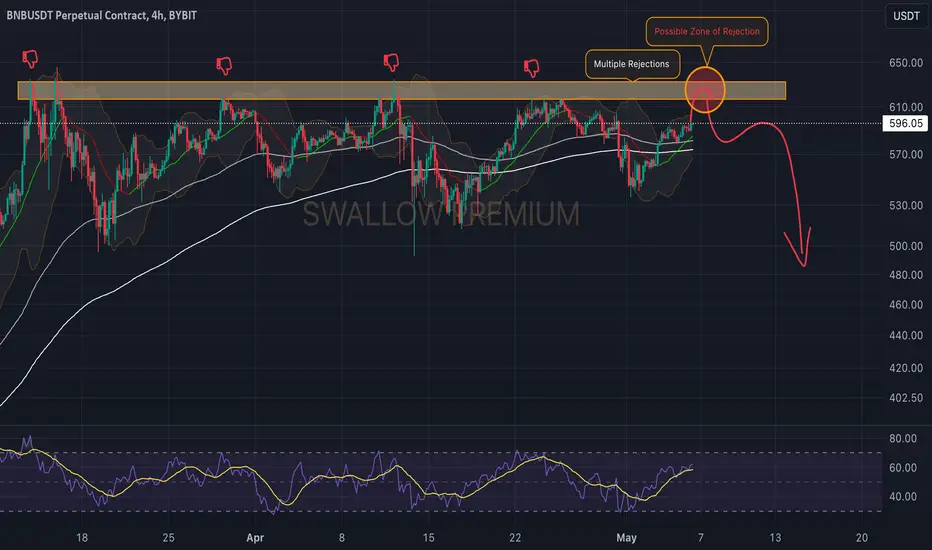
Binance Coin (BNB): Might Go For Another Touch!We are back with Binance coin after that fakeout movement near EMAs (from last TA). We got a nice small 10% market price movement, but nothing too big.
Price went back for bullish movement, reclaiming again EMAs and going for a potential re-test of upper resistance.
We will be looking for that zone there for any possible rejection and a good entry as well!
Swallow Team
Bullish on BNBPrice coming from Daily demand and took out the liquidity on H1 and now ready to target upside buyside liquidity.

BNB primed for lift-offBNB primed for lift-off! 🚀📈 Riding the Elliott Wave on the 1M TF to new heights! 🌟💼 Are you ready for the bullish journey ahead? 🔥💰 #CryptoTrading #ElliottWaveTheory #ToTheMoon"

Trading Signal For BNBUSDT BinanceCoin Trading Setup:
There is a Trading Signal to Sell in BNBUSDT BinanceCoin (15m) (Futures)
Traders can open their Sell Trades NOW
⬇️ Sell now or sell on 601.2
⭕️SL @ SL: 612.3
🔵TP1 @ 562.2
🔵TP2 @ 540.6
🔵TP3 @ 507.1
What are these signals based on?
Classical Technical Analysis
Price Action Candlesticks Fibonacci
RSI, Moving Average , Ichimoku , Bollinger Bands
Risk Warning
Trading Forex, CFDs, Crypto, Futures, and Stocks involve a risk of loss. Please consider carefully if such trading is appropriate for you. Past performance is not indicative of future results.
If you liked our ideas, please support us with your likes 👍 and comments .

$BNB #Binance Trading IdeaBNB/USD (Binance) is still forming an ascending triangle pattern, with huge potential to break its all-time high level. The ATH price is around $692.6. Am I right? After crossing this line, it will start exploring new price targets in that uncharted territory.

BNBUSDT 1W LONG📈Hi all. Timeframe 1 week. BNBUSDT completes triangle formation. At 213.8 there is strong support. Spot recruitment is available now. Also long during breakout/retest. Marked goals/levels on the chart.

BNBUSDT #001 ( Keep your Eyes on bullish Rally $$$ ) Hello dear traders.
Good days .
On daily Gann Square first Gann Arc resistance is broken and passed.
With support from lower Gann Fan line, is about to broken 2nd Gann Arc resistance and start 3rd Bullish leg of Elliot wave .
BNBUSDT is at Time reversal zone and expected from this position start bullish rally.
Chart updated and route plotted with help of Gann Square and Gann Box.
Good luck and safe trades.
Thanks for your support and comments

Is Binance Coin breaking out of its bearish pattern?According to the buying pressure in the market, if the $590 range is broken and the price stabilizes, the price may increase to the $615 range, and if the price is strong, it will reach the $630 range.
Otherwise, the price may fall to the range of $555.

BNBUSDT - Price can break resistance level inside rising channelHi guys, this is my overview for BNBUSDT, feel free to check it and write your feedback in comments👊
Recently price entered to falling channel, where it soon broke resistance level, which coincided with resistance area.
After this, BNB reached resistance line of channel and then bounced down to support line, breaking $604 level again.
Then price made downward impulse, exiting from falling channel and breaking $560 level.
But then, BNB turned around and started to grow inside rising channel, where it broke $560 level again and continued to grow.
Later price reached resistance line of channel, but at once bounced and fell to support line, where now it continues to trades near.
In my mind, Binance Coin can bounce up from support line of channel to $615, breaking resistance level.
If this post is useful to you, you can support me with like/boost and advice in comments❤️

Symmetrical TriangleWait for breakout and breakdown, manage your trade according to your portfolio. Thank you
