TSLA34 trade ideas
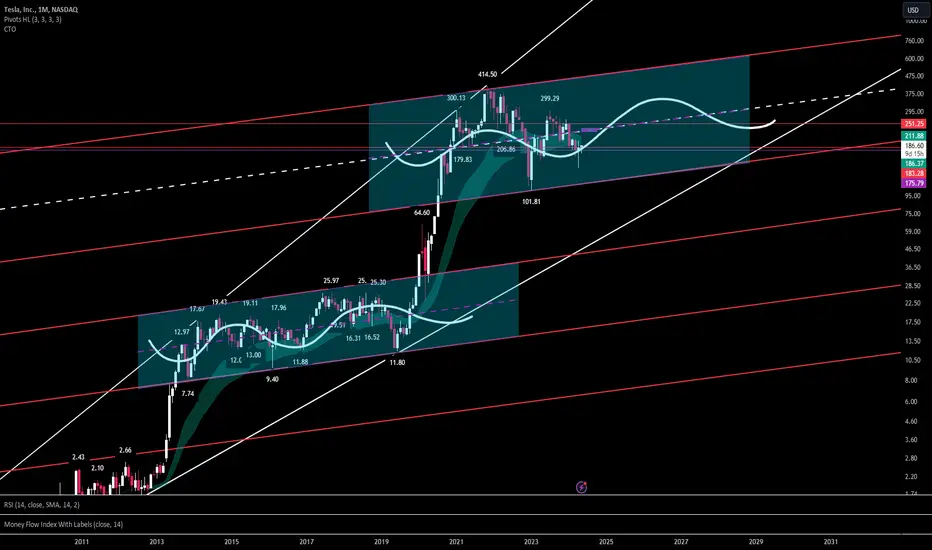
$TSLA #Tesla Parallel Uptrend Begins NASDAQ:TSLA Parallel Uptrend Begins, Algorithm Buy Alert large green dot we start to accumulate, large red dot we do not accumulate we wait.

peeking at $TSLA levels as an option sellerHere are some key headlines related to Tesla, Inc. (TSLA) this week:
Stock Performance: Tesla stock has been trending downward, down 29% this year, but it’s up about 25% from its 52-week closing low1.
Tariffs Impact: A new 25% tariff on Chinese EV batteries and parts could affect Tesla and Ford’s cheapest electric vehicles.
Battery Plant Proposal: Indonesia proposed building an electric vehicle battery plant in the nickel-rich country, and Tesla’s CEO Elon Musk met with Indonesian President Joko Widodo to discuss this.
Discounts for European Fleet Buyers: Tesla is offering discounts to European fleet buyers after retail price cuts impacted fleet value and service issues arose.
Racial Bias Accusations: Tesla is facing accusations of racial bias, including the use of ethnic slurs

TSLA BUYERS are back BUYING... Ascend next.TSLA is firming up a new base after hovering at the 61.8 FIB this past few days -- proving this level as a strong order block support on daily data.
Accumulation / net buying has started pouring in. Ascending higher lows has been registered.
Expect some significant price movement from here on, with a long bias.
Initial targets are the blue boxes.
Spotted at 162.0
TAYOR.
safeguard capital, always.

TSLA: Short-term Probability Analysis | 57.35% Reversal!Short-term analysis of NASDAQ:TSLA indicates that the price is most likely to head to trade above +$200 in the coming days/weeks.
Breaking down the reason behind the current setup and why we should be expecting new mid-term highs:
Feel free to share your thoughts or any feedback you have on the analysis.
Also, if you're interested in analyzing the probabilities directly on your charts make sure to check out the Free Public Indicator that I've published recently!


TSLA FALLING WEDGE - EASY $250, $TSLAThe Falling Wedge is a bullish formation that starts with a wide top and narrows as prices decline. This movement creates a cone shape that slopes downwards as the reaction highs and lows come together. Unlike symmetrical triangles, which lack a clear slope and bias, falling wedges unmistakably slope downwards and exhibit a bullish bias.
-The buy signal has been received.
-Big Hands are buying NASDAQ:TSLA despite the bad earning= BOTTOM
-MODEL 2 (EV Euphoria), FSD (Subscription & Licensing Income), INDIA GIGA FACTORY (cheaper and easier Production), OPTIMUS/ENERGY (Future & Growth)
Buy now and hold until the EOY!
NASDAQ:TSLA

$TSLA WHAT DID I SAY NOW 5% UPGave yall this yesterday
DO NOT SLEEP ON THE POWER OF INSIDE BAR BREAKOUTS
LIKE for the next multi bagger!

TESLA INC - TSLA Prediction May 21st 2024🔴 Resistance - 178 🔴
🚀 Target - 180 - 182 🚀
🟢 Support - 177 🟢
🚀 Target - 175 - 173 🚀
🚫 Manage Your Risk & Reward As Per Your Risk Management 🚫
🔥🔥 Levels Works Best on 5 - 15 Minutes Time Frame 🔥🔥
❤️❤️ MARKET SECRET ❤️❤️👇
1. TRADE WHAT YOU SEE NOT WHAT YOU ASSUME
2. FOLLOW THE TREND BECAUSE TREND IS YOUR ONLY FRIEND
3. CHART IS SUPREME
4. YOUR ASSUMPTION & EMOTIONS HAS NO VALUE IN THE MARKET
Our motto is to help each and every individual to reach and achieve their financial goals across the world by empowering individuals with the accurate knowledge and skills necessary to navigate the complexities of the financial markets successfully. 💪
Please NOTE 👉 Levels shared are for intraday trading only.
🚫 Disclaimer 🚫 All information shared here is for educational purposes only, Please consult your financial advisor for your financial matters before investing And taking any decision. We are not responsible for any profit/loss you make. No Buy Sell Recommended 🚫
Request your support and engagement by like, comment & follow to provide encouragement
CHEERS 👍

$TSLA Right at Resistance.NASDAQ:TSLA I had an alert set on the Area of Resistance Line on this chart. It triggered this morning and I have taken a ½ size position in anticipation of that becoming support. I do not know if it will play out that way so I have a stop under the 50 DMA (red) which would a 4% position risk. Should it move up and over the resistance area I will look to add. All TBD.
The chart I am using is the All-In-One LevelUp tool available here on TV. Check it out.
Ideas, not investing / trading advice. Comments always welcome. Thanks for looking.

TESLA My Opinion! SELL!
My dear followers,
This is my opinion on the TESLA next move:
The asset is approaching an important pivot point 177.57
Bias - Bearish
Technical Indicators: Supper Trend generates a clear short signal while Pivot Point HL is currently determining the overall Bearish trend of the market.
Goal - 174.77
About Used Indicators:
For more efficient signals, super-trend is used in combination with other indicators like Pivot Points.
———————————
WISH YOU ALL LUCK

⚠️Tesla is not bullish now ⚠️☝️The main purpose of my resources is free, actionable education for anyone who wants to learn trading and improve mental and technical trading skills. Learn from hundreds of videos and the real story of a particular trader, with all the mistakes and pain on the way to consistency. I'm always glad to discuss and answer questions. 🙌
☝️ALL videos here are for sharing my experience purposes only, not financial advice, NOT A SIGNAL. YOUR TRADES ARE YOUR COMPLETE RESPONSIBILITY. Everything here should be treated as a simulated, educational environment.

TSLA: Buy ideaBuy idea on TSLA if only if we have the breakout with force the resistance and the vwap by a big green candle follow by a large green volume!

Tesla(TSLA)Everybody familiar with head. shoulders, knees and toes???...
Didn't close below 200 did we?
Either way we still bullish on tesla.
Bias stays the same.

Tesla's kangaroo still hopping. 20/May/24TSLA kangaroo still boxing/ hopping inside the ring (triangle) since end of 2021. Strong support if there was a pullback toward 186 +/-. Which is confluence zone of 1) POC of Volume Profile (red horizontal line) 2) 233 weekly EMA (white MA Line) 3) Pitchfork lower channel (blue).

$TSLA $193 target on horizon?NASDAQ:TSLA has been in consolidation between $170~$175. Last Friday it managed to closed at $177 giving a signal that price is now in breakout. Macd at 0 signal to upside with RSI and William% pointing rising bullish divergence. The first target is $193 .

Tesla is ready to take offLook at this beautiful RSI!
It just broke out and retested the support line.
Perfect pattern before takeoff.
How high will TSLA go? $280 or more?


Tsla is forming an inverse head and sholders and goldern cross tsla is heading towards 250 as its forming a golder cross and an inverse head and sholders

$TSLA RARE INSIDE WEEK CLOSE
My Plan:
Calls > 179.65
Puts < 169.92
Price is COILING and is setting up for a MASSIVE BREAKOUT
I plan to FULLY Automate these trades with my options auto trick guide
LIKE IF UR IN!

TSLA LONG 1 YEAR LONG OPTION AVAILABLE @ 5.12 R:R RATIOPE dropped to 44.68 from previous PE ratio of 100+. Castle in the sky is no longer flying, we're going 400mph on the ground now. Prepare for liftoff.
MACD bullish divergence spotted with heavy oscillator divergence against RSI. RSI rejected bullish control zone earlier this month around last Friday. 1.618 fib extension ratio possible. Take profits at 2, 3, 4, 5 R:R ratios.
Strap in boys, we're going LONG.
Love,
dysonring2050

TSLA 6H BUY SIGNAL SSV 6H support is now at ~$170
Enter 50% at the current price
and try to set some BUY orders near the support zone
Cheers

$TSLA LONG. Swing trade or long term addition Inverted chart here. Good area here for long entry IMO.
.786 Retracement
Divergence on price action & RSI
Triangle breakdown extended
