Nasdaq Bear Markethave sight of a parallel descending channel on nasdaq. Buckle up! Additions on the top of the channel. Profit taking on the break from channel up. I hypothesize it runs like this for days, but have to keep watchin'
NAS100 trade ideas


NAS100 SELL NOW!!!!!!!!!NAS100 Completed 2000pips move from my point of entry analysis now we are moving to sweep liquidity above the fvg zone at 18538 am taking a sell entry from that zone once we have a liquidity sweep with bearish candle confirmations
JOIN AND ENJOY.............


BUYGoldium Trade Hub
Our Purpose is to give daily position, kindly follow below instruction in order to get positive result.
❇️ Use fix lot size for all your position ( we recommend to use 1% of your account for each postion ).
❇️ Do not enter position if its away from entry point.
❇️ Do not close position before target price unless instruction given.
❇️Three maximum trade per day so please enter all position.
❇️ If we get multiple stop loss do not scare and continue following our instruction and enter given positions.

US100Bearish Divergence on RSI appeared on 1 hr time frame and it printed LH and LL. It retraced upto 61.8 level. Sell trade upto recent LL level (double bottom).


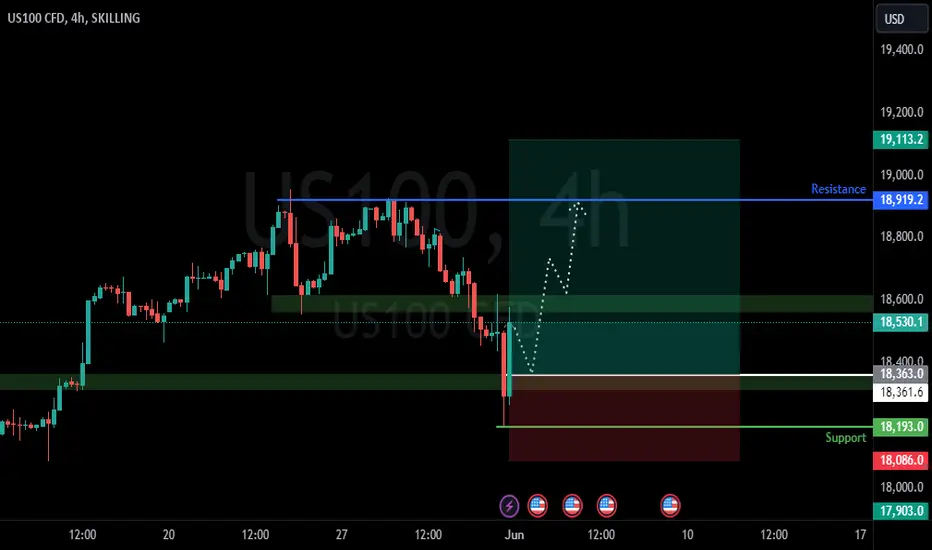
NASDAQ 4H OUTLOOKNASDAQ 4H TIMEFRAME
1. Trend and Structure
• Current High and Monthly Resistance:
The NASDAQ is currently at a high of 18950.0, facing monthly resistance, which is indicated by a bearish candlestick.
• Monthly Support Levels: The index has broken above the 18390.3 level, which is a significant monthly support level.
2. Support and Resistance Levels
• Monthly Resistance: 18950.0
• Monthly Support: 18390.3
3. Trendlines and Patterns
• Supporting Trendline: The trendline indicates a bullish structure.
• Potential Reversal Zone: Watch the yellow zone for a possible M pattern (double top) formation, suggesting a potential reversal if confirmed.
Conclusion
• Current Bearish Signal: The bearish candlestick at the 18950.0 resistance indicates selling pressure.
• Key Levels: Monitor reactions at the 18390.3 support and the potential M pattern formation in the yellow zone for possible reversal signals.

Will Bulls Balk at Trendline Resistance?Price of NDQ is nearing a trendline formed by the dotcom bubble and November 2021 high. This zone could repel price, big drops can be expected if we breach the price of 16249.19 on pullback. For now bystanders are needed to enter, unless a clear cycle failure best not to stand in the way of exuberant bulls.

What Is The Direction Of the US 100?This price action is showing a buying signal and
you will see it go up and up
But here is the catch the Dow Jones CAPITALCOM:US30 is crashing
how is this even possible?
You know i thought that the markets all move in the same direction and i am
so wrong about this theory because most financial experts
online have this theory spinning to make you think that trading is this
easy thing that you will understand in one video
But this theory is not true, trading is a skill a life skill
its very similar to somebody who has dedicated their life to learning
how to build a house or make artefacts.
Seeing this buying signal has really put me in shock because it is not following
the Dow Jones.
The fake stock market gurus are shaking right now
Rocket boost this content to learn more
Disclaimer:Trading is risky and you will lose money please do your own research before you buy or sell anything

CHART BREAKDOWN US30: Key Levels, Targets!Brief Description🖊️:
The chart provides insights into critical market levels, emphasizing an essential demand zone (low-risk buy zone) spanning from 18330 to 18315, respectively, are highlighted.
Things I Have Seen👀:
Important Demand Zone🟢: Identified between 18330 and 18315, serving as a low-risk buy.
Bullish Targets📈:
18400: Possible retracement area.
18500: Possible retracement area.
18580: Possible retracement area.
18670: Area with a lot of liquidity.
What's Important Now❗
Currently, the crucial approach is to wait and observe the price action at this level. We need to assess how the market reacts before considering any decisive moves. Stay observant and responsive to real-time developments in the market.

Channel breakout Index is near bottom of orange channel and also near to 1D SMA50
I think it will going to break soon because correction is not over yes
I suppose a final destination of 10% at around 17000

Nasdaq in potential sell zone!!Hi Guys
At this moment the US 100/ Nasdaq is in what could be a potentialzone to look for sell opportunities.
The low of the red box is the 1.27 retracement of the recent pullback and the high of the box is the 0.618 extension of the last impulsive move on daily time frame i.e 8/5 to 16/5 to 17/5.
Lower time frame entriesusing whatever method one chooses may present some nice risk to reward trades.
Safe trading all.

A short term analysisUs 1 year bond is showing a strength which means dollar will or might do the same thing, expenditure of dollar will go to stock etc, on the other hand, the stock VALUE will be allocated to paper money DOLLAR
Not a financial adviice

NAS100 FORECASTThe previous updated analysis on NAS100 indicates that it has successfully reached our full target. Currently, it is expected that the prices will fluctuate within the range of 18,890 to 18,712. However, if the pivot line at 18,712 is breached, the decline is likely to extend to 18,642.
Key Levels:
Bullish Line: 18890, 18970, 19050
Pivot Line: 18712
Bearish Line: 18805, 18642, 18548, 18330

NAS100 FORECASTThe current forecast for OANDA:NAS100USD indicates a likely bullish trend. As long as the 4h candle opens above 18550, the index is expected to trend upwards, initially reaching 18725 and then continuing to the strong bullish target of 18805. Conversely, if the 4h candle opens below 18550, the trend will likely shift downward, first reaching 18415 and then moving to the strong bearish support at 18330.
Key Levels:
Bullish Line: 18675, 18725, 18805
Pivot Line: 18550
Bearish Line: 18475, 18415, 18330

NASDAQ (AND OTHERS INDEX) SHOULD HAVE CORRECTIONWhether it's a deep correction or it's gonna be a reversal that people are expecting for quite long, i believe it's time to SELL.
#THEBIGSHORpartII

NAS100USD Is Going Up! Buy!
Here is our detailed technical review for NAS100USD.
Time Frame: 1D
Current Trend: Bullish
Sentiment: Oversold (based on 7-period RSI)
Forecast: Bullish
The market is on a crucial zone of demand 18,905.8.
The oversold market condition in a combination with key structure gives us a relatively strong bullish signal with goal 20,101.7 level.
P.S
We determine oversold/overbought condition with RSI indicator.
When it drops below 30 - the market is considered to be oversold.
When it bounces above 70 - the market is considered to be overbought.
Like and subscribe and comment my ideas if you enjoy them!

