HUBS trade ideas


$HUBS Buy the Dip$HUBS HubSpot - Possible dip buy opportunity here at support. Solid company in a strong uptrend for past year+.
Medium term target: $850-$900 range by mid-January
Note: This is NOT investment advice. Educational only.

growth to $920stocks move for a long time in an uptrend. after breaking through resistance, I expect growth to $ 920

Hubspot Inc Hitting $700: Take Profit For +5.5%The pennant pattern worked as expected and the share is now +5.5% (ungeared) since publication this past Monday. Take profit here.

Trade Setup: HubSpot Inc - Pattern PlayThis is a 'higher risk' trade and isn't what you may normally see me propose. Nonetheless, we have a consolidation range that has developed to form a flag pattern. This follows the 'earnings gap' (on volume) on 05-August. The aforementioned consolidation has been on declining volume, suggesting minimal selling into these highs.
Long above $669
Stop: $648
Target: $722
Last Close: $663.66

CupNo super great handle but I drew the green line where I see support. You may see it elsewhere. but it does look like HUBS has been on a run. Price is outside the top bollinger band set on 80 which indicates extreme buying pressure. Possible pull back.
The moving averages are all lined up in order and are sloping up.
No recommendation
There is something in the air (o:


HUBSPOT StructureHey traders, HUBSPOT is in a fake bullish move with strong past sell volume and an upside down doji. The TIMEFRAME M1 shows us a marubozu with a fake return of traded sales volume, it leaves towards its lowest filled a bullish breakout gap. With the base of the bolllinger in consideration making its reversal on the top of the bullish channel will be checked without following the bollinger.
And to finish at the top of the comfort zone, there is a strong possibility of breaking out the price with the return of momentum at the same time in the zone. To join the one before and make a new high big chance of direct breakout the top of the bullish channel. Then the comfort zone to fit into yet another with testing from the top of it for a key figure of 490.00 for 498.00.
Please LIKE & FOLLOW, thank you!

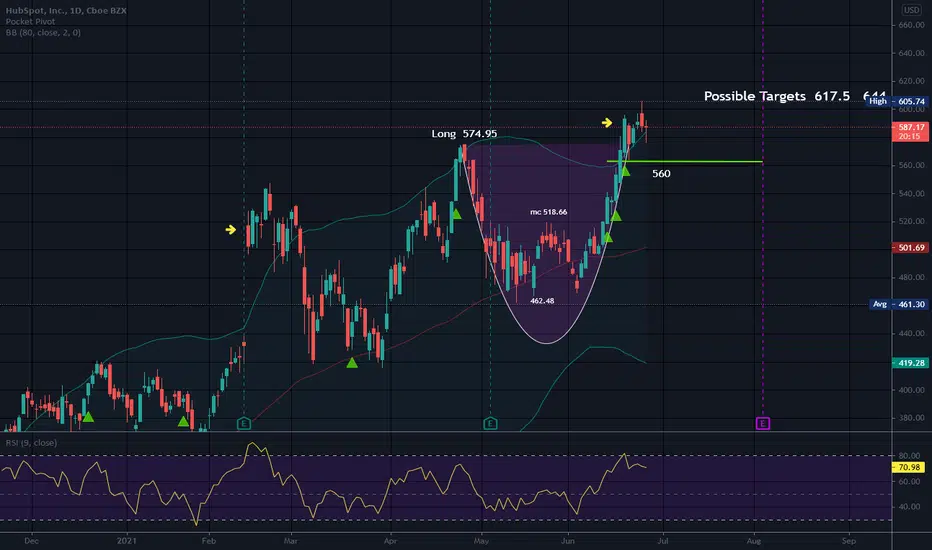
Long $HUBSI am seeing a great bullish set up for $HUBS, several reasons, but mainly... stock has consolidated after super powerful mode and had consolidated for more than 2 months. Our algo spotted today there's was a pocket pivot along with TTM_Squeeze. Be aware, earnings are two weeks out, so maybe options trade would be a good option taking advantage of volatility increase prior earnings. 450 or 500 strike price would be a good one, the one thing I do not like is open interest is very low.


HUBS - December 12, 2020HUBS is a software integration company that empowers businesses to interpret analytics and data. It has had a strong year and has the potential to make new highs in the next few weeks. This is a dip buy.

HUBSPOT | Guess SpotHubspot has been riding a nice channel up since March low. But what stock hasn't? There was some BIG sell volume from the previous week which lets me know that we will be sitting sideways for the comming weeks. As I've annotated before, the earnings will dictate the future direction.


Cup and Handle Patterns above PatternsHUBS broke up from another C&H pattern a while back
Not to long entry level today
This is a pattern over a pattern and not a yearly C&H pattern
Momentum seems to be with this one and social media is having a good time in the market right now
NV is high
There are no rising wedges that I see in this chart
Not a recommendation

Cup and HandleGAP under price. Beware
Gaps can provide support
HUBS broke out of the C&H pattern a while back and has met T1
Stocks do not always go on to meet targets 2.
Targets 2 usually occur much later after a significant pull back.
There are no rising wedges that I can find in this chart..so no irrational exuberance noted.
Unusual for a tech stock in our current market. Many are in one or have fallen from one in the last several months
NV is still very high for HUBS and short interest is less than I would have thought it would be
I sold this a while back and the strongest S I see is at the gap
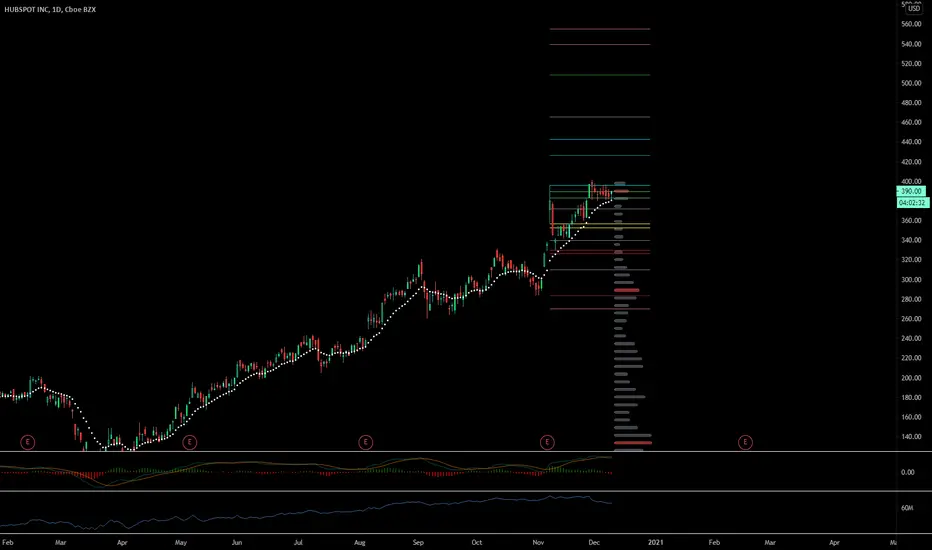
Drop today This stock has fallen to 263ish recently
Just watching and not a recommendation
Not one I would just jump in to. I have alerts set and will follow it down..or up..lol
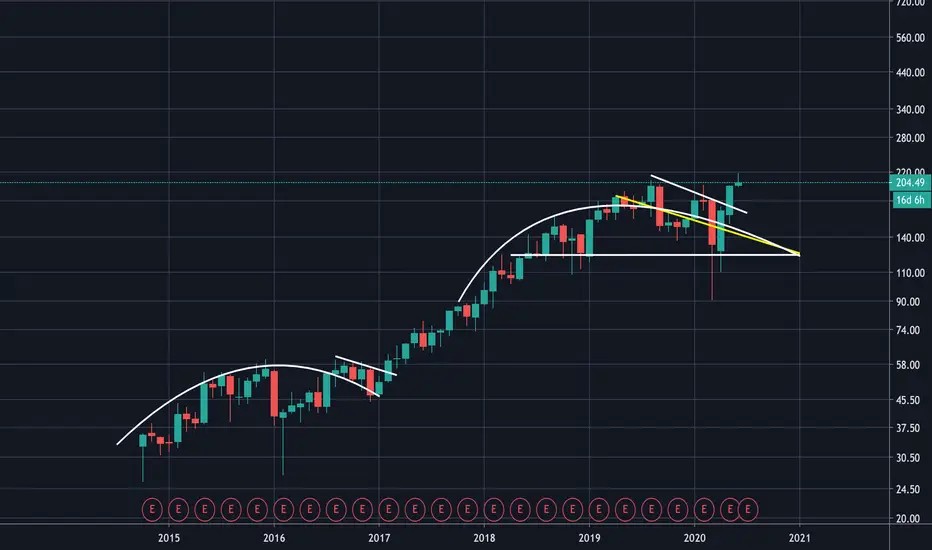
OVERBOUGHT!! - Add to watchlistAlthough a good stock to add to the watchlist, it is currently overpriced.
I would like to see this get below the 80MA which according to the Williams% chart, tends to be when the stock is oversold.
HUBS currently needs a lot of movement to get down to the 80MA, set alarm up crossing the $200 and watch daily from there moving forward.
The green area is an up trending resistance zone which has been recently tested, will it breakthrough the resistance?
There's a good chance it will however I'm hoping for a correction, where speculators can potentially buy in around the $225 mark.
I personally won't but I don't like to speculate or take the riskier approach.

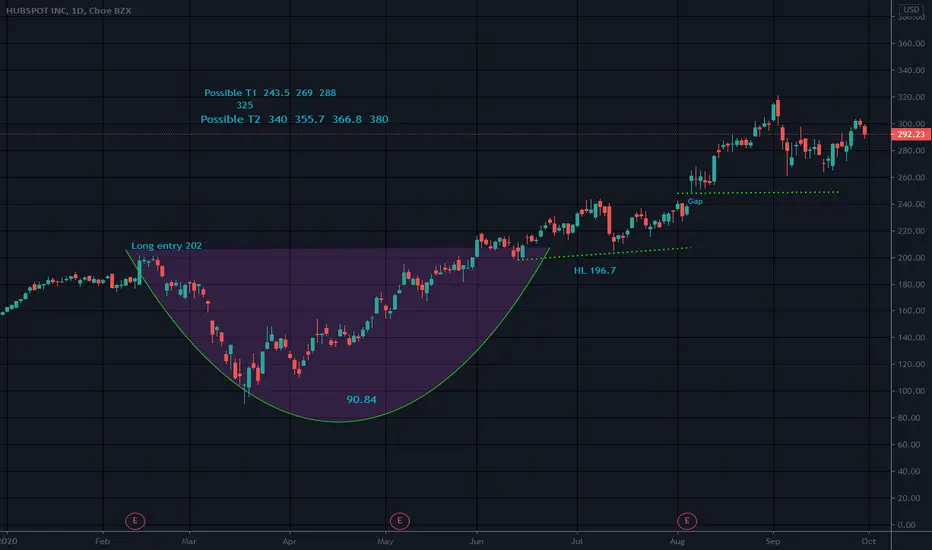
Cup and Handle What are the Targets?HUBS broke out at 202 from it's C&H pattern
Earnings 8-5 amc
Doesn't appear parabolic either. Small pull back today
HUBS appears to have moved up in a healthy fashion, but we always know the market can change in a heartbeat so be safe
I have a trailing stop on this one
Good luck!