Bearish on $API31. we have a change in state of delivery indicating bearishness,
2. we have a run on a high.
3. we have price reacting well off the entry fvg.
4. we are still at premium levels ideal for shorts.
API3USDT trade ideas

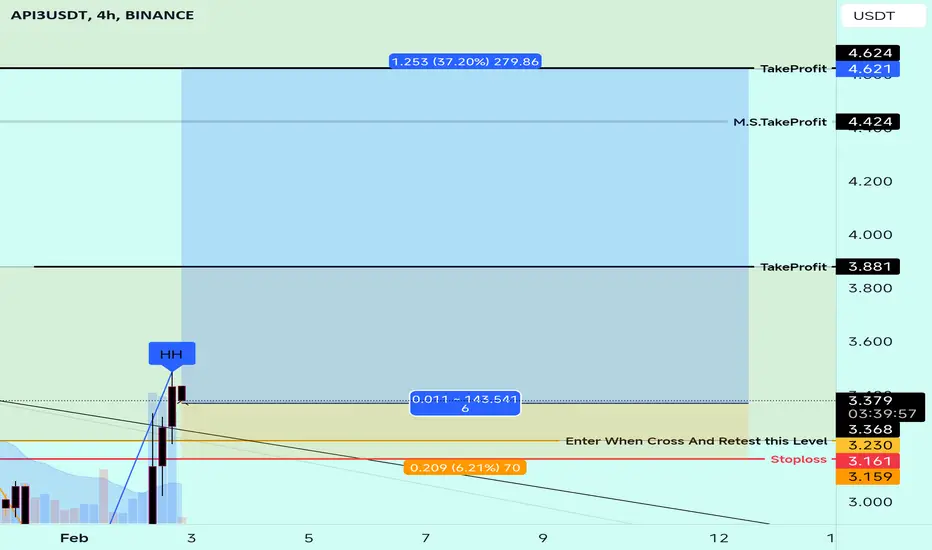
API3USDT Rising Wedge After several tests, it has taken a downward phase and is suitable for sales transactions.
It will drop by almost 30%

API3USDT IDEAFalling Wedge Successfully Breakout In 3D CHART📈
Currently Running In 45% Profit So Far & Expecting 150-180% Profit In Coming Days🔥

API3 Buying Frenzy: Seize the Opportunity Now## API3 Coin: Fundamentals, Recent News, and Disclaimer
**Disclaimer:** I am not a financial advisor and this is not financial advice. Please do your own research before making any investment decisions.
**Fundamentals:**
* **What is it:** API3 is a decentralized API layer for Web3, enabling secure and reliable access to off-chain data for blockchain applications.
* **Unique selling points:**
* **Decentralized:** Data providers, consumers, and API3 stakers maintain control and transparency.
* **First-party data:** Eliminates reliance on centralized oracles and cross-chain bridges.
* **DAO governance:** Token holders vote on proposals to shape the project's future.
* **Tokenomics:**
* Total supply: Not available
* Circulating supply: 86,421,978 API3
* Token uses: Staking for rewards, governance participation, and fee discounts.
* **Current price:** $3.27 (as of February 2nd, 2024)
* **Market cap:** $283 million
**Recent News:**
* **January 31st, 2024:** API3 price surges 23.77% in 24 hours.
* **January 27th, 2024:** API3 partners with Chainlink to expand oracle network reach.
* **January 25th, 2024:** API3 integrates with the BNB Chain ecosystem.
**Additional Notes:**
* API3 is a relatively new project with a small market cap.
* The cryptocurrency market is volatile and high-risk.
* Past performance is not indicative of future results.
**I cannot provide a disclaimer without understanding your specific context and intended use of this information. Please be cautious and consult with a financial advisor before making any investment decisions.**
API3USDT IDEAHey traders hope you are enjoying our analysis. Now we are here again with a new trading opportunity. We will discuss today about API3
API3 Falling Wedge Breakout Has Already Done in 1W Timeframe
Running in 50%+ profit so far✅
Expecting 150%Bullish Wave

API3 BIG RISK BIG GAINThis coin, about which I do not know much fundamentally, as long as it is above 1.56 and does not close the day below that level, maybe try something higher. There is not too much history to know so we will be looking at ATH which is 3x this price. Below, set a stop loss at the level I said and try DCA

API3_USDT Trade IdeaToo much of gaps down there, it has pumped enough and should retrace. A quick 1:3 RR Trade, you can decide to hold longer

API3USDT POSSIBLE LONG TRADEManage risk during news time, intraday trade tp and sl mentioned not a financial advice

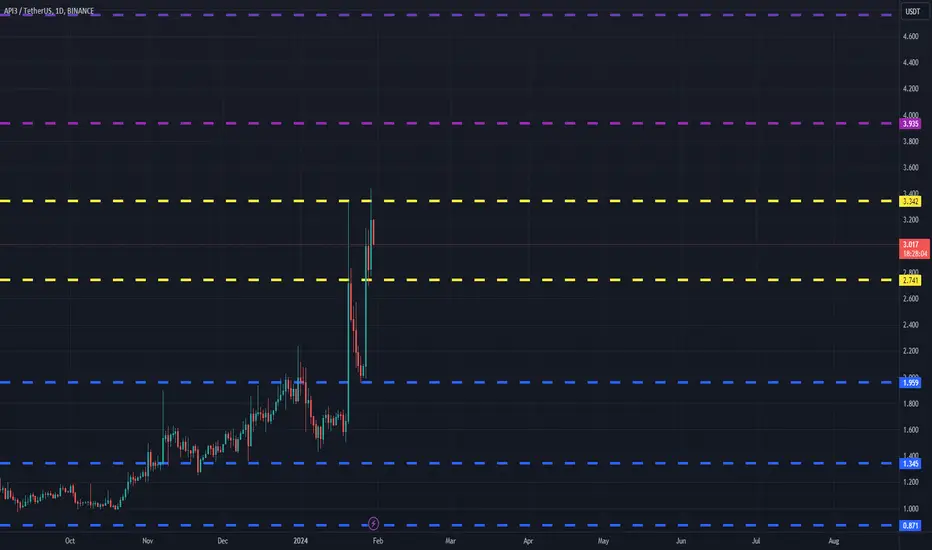
API3USDT(API3) Daily tf Range Updated till 30-01-24API3USDT(API3) Daily timeframe range. in a tight place it tried twice at 3.342 still got volume here. if it can stay above 2.741 than clearing 3.342 wouldn't be much of problem. but 2.741 is not a solid ground either.
API3USDT - BULLISH OUTLOOKAPI3USDT is currently demonstrating a bullish divergence on the 1-hour (1H) time frame, indicating a potential bullish reversal. This divergence suggests a weakening of the prevailing bearish momentum and the possibility of a shift toward an upward movement.
For traders considering a position, the following trading strategy is proposed:
Entry: Consider initiating a long position using a Buy Stop order at the price level of 1.6170.
Stop Loss (SL): Implement a risk management Stop Loss order at 1.50.
Take Profit (TP): Set take-profit levels to achieve a 1:1 and 1:2 risk-reward ratio:
TP1 = 1.7370
TP2 = 1.8570
This trading strategy aims to capitalize on the anticipated bullish reversal. However, it is crucial to closely monitor the market for any changes in price action and be prepared to adjust the strategy accordingly.

API3USDT.PAPI3USDT.P is in bullish trend.
Bearish divergence also shown in RSI.
Rising wedge reversal pattern also form.
This two sign strogly indicates that the trend will be reverse if it breaks the wedge pattern downward.

API3USDT.4HBased on the provided market data for the API3/USDT trading pair, here is a technical analysis:
As of now, the current price of API3 is $3.378. The Relative Strength Index (RSI) on the 4-hour, 1-day, and 7-day charts are 78.65, 71.31, and 78.09 respectively. These values are all above 70, which often indicates overbought conditions and could suggest a potential price correction in the near future.
The Moving Average Convergence Divergence (MACD) on the 4-hour, 1-day, and 7-day charts are 0.256, 0.291, and 0.372 respectively. These positive values suggest that the market is currently in a bullish phase.
The Bollinger Bands (BB) values are 3.553, 3.519, and 3.500 for the 4-hour, 1-day, and 7-day charts respectively. The price is currently above the middle Bollinger Band in all three timeframes, indicating a potential continuation of the upward trend.
The resistance levels on the 4-hour chart are at $3.470, $3.678, and $3.975. On the 1-day chart, they are at $3.553, $4.099, and $4.800. On the 7-day chart, the resistance levels are at $3.522, $3.982, and $5.260.
The support levels on the 4-hour chart are at $2.661, $2.121, and $1.893. On the 1-day chart, they are at $2.660, $2.160, and $1.900. On the 7-day chart, the support levels are at $1.693, $0.981, and $0.500.
In conclusion, the market for API3/USDT appears to be in a bullish phase based on the MACD and Bollinger Bands. However, the high RSI values across all three timeframes suggest that the pair may be overbought and could be due for a price correction. Therefore, traders should proceed with caution and consider setting stop losses to protect their positions. As always, it's important to also consider other market factors and conduct further research before making any trading decisions.

api3If he can stabilize above 2.943, he can see those two red lines
Currently, we have a pattern in the picture that I do not like very much

API3 Long 3.105
1. Accumulation 616 days
2. After the approach of a paranormal bar and a false breakout, the instrument does not roll back down
3. At 4h sticking to the level
4. There are no strong levels at the top
Comment: if the daily pressure continues and consolidation along the level continues, I expect a breakout of the level. The nearest strong level is 3.680

API3 Breaking stage 1!Api3 is going to break his stage 1 with a sustain volumes behind it. the level to break is the 2.7$ resistance level which is a good barrier to be broken.Lets see above it if create a sustainable trend and reach the possible potential target of 8$!
good trading!

API3USDT, Short Short Term. 3 - 5 days set up. Always put sl on your trade. Trade responsibly. Dont RUsh market is always there.
Haste is waste and Patience is power. Goodluck traders

Long Squeeze? On the Atls! Short on API3. Double top on the daily tame frames. Money coming out on the small time frames, putting bearish divergences with higher price action and lower momentum waves. Yes Money is creeping to the upside on the 4 hour but vwap is trending to the down side. Simply there is a deviation in the volume profiles and i believe the fair price for this asset is not worth 3.12.

API3 Flush?Already in a low leverage swing short from 2.8.
Was Targeting 1.9 at least didn't hit the target yet.
Adding leveraged margin from here around 2.4100.
Because expecting a quick flush from here towards 2.
Will close if the whole position if breaks this level.
Note: Not a Financial Advice.

API3 Analysis: Prime Refill Opportunity for Longs 📈Hello Traders,
Last week, API3 caught the market's attention with a remarkable 2x price increase, showcasing its volatility and potential for significant moves. However, as expected in the crypto world, it has retraced from its peak, presenting what I believe is an ideal refill opportunity for those looking to go long.
📊 Current Analysis:
Bullish Indicators: Despite the retracement, API3's chart patterns and underlying fundamentals suggest a bullish outlook. The asset is maintaining key support levels and showing resilience.
Shorts Piling Up: Interestingly, there's a noticeable increase in short positions on API3. This scenario sets the stage for a potential short squeeze, which could propel prices upward as shorts cover.
Why API3?
API3 is more than just a token; it's at the forefront of bridging decentralized APIs with blockchain technology. Its recent market behavior coupled with strong fundamentals makes it a noteworthy candidate for long positions.
Remember, the crypto market is dynamic, and while API3 shows promise, it's crucial to stay informed and agile.
PS: Struggling to find precise entry targets and stop losses? Comment for more information on signals, real-time analysis, and more. We focus on maximizing gains while minimizing risks. Don’t miss out on actionable insights that could elevate your trading game.
Happy Trading!

API3/USDT burj khalifa patternwaiting to burj khalifa pattern entry at DCA box stoploss above DCA zone

API3USDT IDEAHello Trading view Family / Fellow Traders.
I hope you have used and benifited from the previous analysis .
In today trading session we are monitoring API3USDT for a buying opportunity,
API3USDT UPDATE
Moving Exactly As we Predicted Finally Hits Our Target 70% Profit Done ✅ 💥

#API3/USDT#API3/USDT
The price has been moving in a bearish flag since July 2022
Moving average 100 was broken
Current price 1.61
First goal 2.43
Second goal 2.95
Which represents 200% of the current price

API3/USDT Process Downward to the support area. Could Bounce ??💎 API3's market dynamics have been garnering a lot of attention lately. At the moment, API3 is navigating a downward trajectory toward a key support area, entering what appears to be a retesting phase following a Bullish Trap scenario.
💎 The upcoming period is critical; if API3 successfully bounces off this support level, it could mark the start of an upward movement, potentially leading to an attempt to break through the resistance pattern.
💎 A successful breach of this resistance probability could pave the way for API3 to reach its target in the strong resistance area.
💎 Conversely, if API3 fails to demonstrate a bounce during this retesting phase at the support level, it may signal a worrying shift. Such a failure to hold the support could indicate a reversal to a bearish trend, pushing API3 towards a lower, more robust support area.
💎 This scenario would be crucial, as a failure to maintain above this stronger support could lead to further downward momentum.
