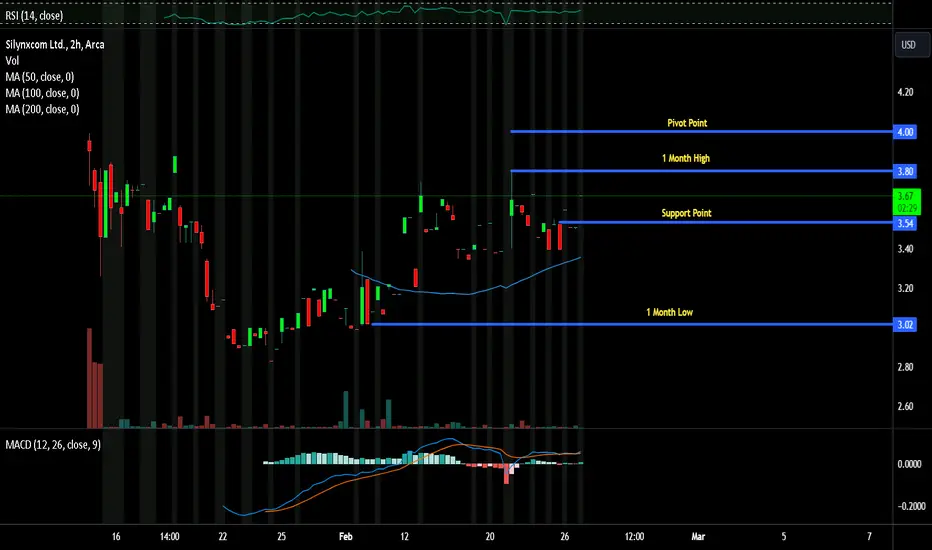
$SYNX broke the wedge pattern and is breaking out nowAMEX:SYNX textbook break of this wedge pattern and now is climbing towards $4 break.
−0.89USD
−2.82 MUSD
7.63 MUSD
About Silynxcom Ltd.
Sector
Industry
CEO
Nir Klein
Website
Headquarters
Netanya
Employees (FY)
29
Founded
2021
ISIN
IL0011990749
FIGI
BBG01JYZ8R22
Silynxcom Ltd. engages in the development, manufacture, market and sells communication headset devices. It specializes in developing the In-Ear Headset device, a subsegment of the Personal Headset Device market. The In-Ear Headset device is used in both training and operations by the military, law enforcement, and disaster recovery industry professionals. The company was founded on August 22, 2021 and is headquartered in Netanya, Israel.

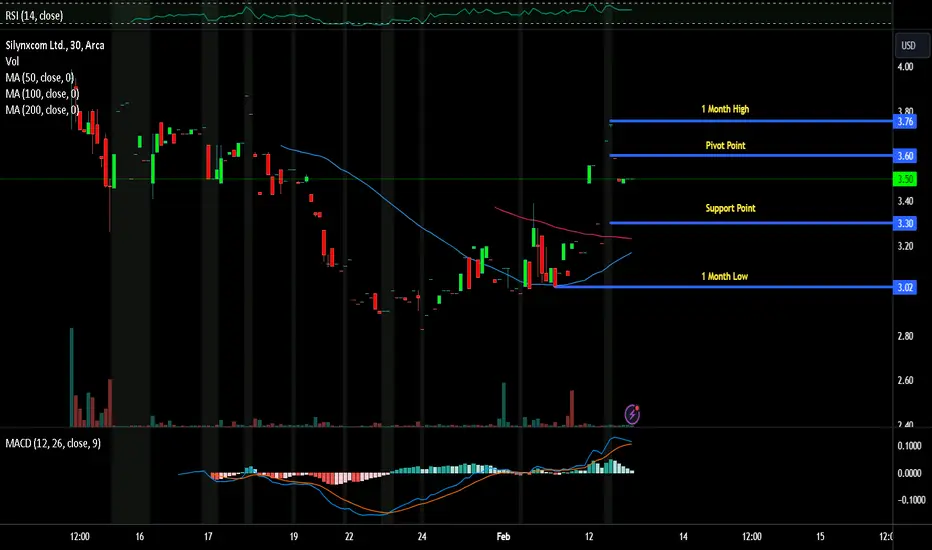
$SYNX ready to breakoutAMEX:SYNX ready to break out, watching for $3.70 to fall. Symmetrical triangle pattern getting tight.

Silynxcom Ltd. (SYNX) Surges as Military Orders Top $1 MillionSilynxcom Ltd. (NYSE: AMEX:SYNX ) emerges as a frontrunner, marking significant milestones with a recent follow-up purchase order valued at approximately $280,000 from a prestigious military customer. This order, encompassing Silynxcom's advanced Clarus In-Ear Headsets, underscores the company's gr
$SYNX riding the uptrend Newly trading AMEX:SYNX has formed a nice uptrend pattern here and seems to be riding strong support. New one to keep an eye on.

Silynxcom's Strategic Expansion
Silynxcom Ltd. (NYSE: AMEX:SYNX ), a pioneering manufacturer of ruggedized tactical communication headset devices, has made significant strides in bolstering its market presence with a series of lucrative orders from the Israel Defense Forces (IDF) and Israeli police forces. Amidst a volatile geopo
See all ideas
Trade directly on the supercharts through our supported, fully-verified and user-reviewed brokers.


Frequently Asked Questions
The current price of SYNX is 2.84 USD — it has increased by 3.65% in the past 24 hours. Watch Silynxcom Ltd. stock price performance more closely on the chart.
Depending on the exchange, the stock ticker may vary. For instance, on AMEX exchange Silynxcom Ltd. stocks are traded under the ticker SYNX.
SYNX stock has risen by 18.33% compared to the previous week, the month change is a 27.55% fall, over the last year Silynxcom Ltd. has showed a 28.82% decrease.
We've gathered analysts' opinions on Silynxcom Ltd. future price: according to them, SYNX price has a max estimate of 8.00 USD and a min estimate of 8.00 USD. Watch SYNX chart and read a more detailed Silynxcom Ltd. stock forecast: see what analysts think of Silynxcom Ltd. and suggest that you do with its stocks.
SYNX reached its all-time high on Mar 12, 2024 with the price of 4.10 USD, and its all-time low was 2.34 USD and was reached on May 10, 2024. View more price dynamics on SYNX chart.
See other stocks reaching their highest and lowest prices.
See other stocks reaching their highest and lowest prices.
SYNX stock is 3.52% volatile and has beta coefficient of −2.29. Track Silynxcom Ltd. stock price on the chart and check out the list of the most volatile stocks — is Silynxcom Ltd. there?
Today Silynxcom Ltd. has the market capitalization of 8.66 M, it has increased by 1.26% over the last week.
Yes, you can track Silynxcom Ltd. financials in yearly and quarterly reports right on TradingView.
SYNX net income for the last quarter is −493.00 K USD, while the quarter before that showed −2.33 M USD of net income which accounts for 78.80% change. Track more Silynxcom Ltd. financial stats to get the full picture.
No, SYNX doesn't pay any dividends to its shareholders. But don't worry, we've prepared a list of high-dividend stocks for you.
As of May 17, 2024, the company has 29.00 employees. See our rating of the largest employees — is Silynxcom Ltd. on this list?
EBITDA measures a company's operating performance, its growth signifies an improvement in the efficiency of a company. Silynxcom Ltd. EBITDA is −2.65 M USD, and current EBITDA margin is −34.72%. See more stats in Silynxcom Ltd. financial statements.
Like other stocks, SYNX shares are traded on stock exchanges, e.g. Nasdaq, Nyse, Euronext, and the easiest way to buy them is through an online stock broker. To do this, you need to open an account and follow a broker's procedures, then start trading. You can trade Silynxcom Ltd. stock right from TradingView charts — choose your broker and connect to your account.