How do I simulate trading with leverage?
The basics
All strategy scripts written in Pine Script™ v4 and above natively support the simulation of leverage trading, i.e., borrowing from a broker to open larger positions with smaller amounts of capital.
With leverage trading, it's possible for traders to place orders with larger sizes than their account balance would otherwise allow, as long as the trader's account maintains the required margin to sustain the loan.
NOTE: Leverage trading amplifies potential profits and losses. Traders should always exercise caution and thoroughly assess their risk appetites before utilizing leverage in live trading.
Pine Script™ strategies determine the leverage amounts applied to simulated long and short trades via the "Margin for long positions" and "Margin for short positions" inputs in the "Properties" tab of the script's settings. These inputs define the minimum percentage of a position's value required in the account balance for the strategy to simulate opening and sustaining the position.
For example, a "Margin for long positions" value of 20% means that the simulation will require 20% of any long position to be covered by the strategy's available balance, with the remaining 80% covered by the emulated broker. Since any long position only requires one-fifth of its value to be funded by the account, the strategy can simulate long positions of up to five times its available balance. In other terms, this level of margin (1:5) increases the strategy's leverage to 5:1.
If a trade with this level of margin loses enough money to put the broker's funds at risk, the emulated broker will trigger a Margin Call event and liquidate some or all of the open position to free up capital. See the sections below for more information.
NOTE: Programmers can define the default margin values in their strategy scripts via the `margin_long` and `margin_short` parameters of the `strategy()` function.
The details
When a trader borrows from a broker to increase purchasing power, the broker will require them to have a minimum amount of capital in their account to use as collateral, otherwise known as margin. In other words, margin is the portion of the position the trader must cover with their own equity in order for the broker to cover the rest.
The margin allocated toward a trade is the product of the position's market value and the margin ratio (i.e., the reciprocal of the desired leverage ratio).
Suppose the current rate of EURUSD is 1.05, and we want to simulate purchasing a standard lot (100,000 units) without borrowing funds from the broker (i.e., using 1:1 leverage). In this case, we set the "Margin for long positions" to 100%, instructing the strategy to place orders using only its available funds. Therefore, the account must have at least 105,000 USD (1.05 * 100,000) available to facilitate the trade.
Now, suppose we wish to simulate the same trade with 20:1 leverage. In this case, the margin ratio is 1:20 (5%). Setting the "Margin for long positions" to 5% specifies that the account balance must be at least 5% of the position's value to simulate receiving the other 95% from the broker. The minimum account balance (margin) required to facilitate this trade is 5% of 105,000 (5,250 USD).
Unlike the example that doesn't rely on broker funds, opening a position with 20:1 leverage in a real-world setting carries a risk of loss for the account holder and the broker. If the open position loses more than the account balance can cover, the broker will either request more funds from the trader or forcibly liquidate some/all of the open position to cover the losses. The Strategy Tester represents forced liquidation scenarios as "Margin Call" events.
Our Broker Emulator handles these scenarios in strategy results by liquidating four times the amount required to cover the loss in the simulation, preventing constant Margin Call events on subsequent chart bars.
NOTE: Short trades typically entail borrowing shares, units, etc. from the broker and selling them later at another price. The position's value represents the cost of buying an equivalent number of shares, units, etc. to return them. As such, short trades lose money when prices increase. Unlike long positions, the potential loss on a short position is uncapped, as there is no definite limit on how far an instrument's price may rise. Therefore, even with 100% margin, a short position faces the risk of forced liquidation.
Strategies can also simulate unconventional margin requirements. For example, one could use a "Margin for long positions" value of 200%, meaning the simulated account must have at least twice the position's value to facilitate the trade and maintain the position. This setting effectively limits the maximum position size to 50% of the strategy's equity.
It's important to note that the margin settings of a strategy script allow it to validate position sizes. When disabling margin requirements by setting them to 0%, the script can simulate positions of any size, regardless of the actual capital available in the simulation, which can produce misleading results. Therefore, we do not recommend setting the "Margin for long positions" or "Margin for short positions" values to 0%.
Running out of funds
The primary caveat to leverage trading is that it increases the risk of running out of funds. Positions forcibly closed by a broker substantially reduce a trader's ability to recover from losses and can accelerate their account toward depletion. The Strategy Tester represents forcibly closed positions as "Margin Call" events.
The formula that governs when a Margin Call event happens is:
CurrentEquity <= MarginRequired
The CurrentEquity value is the amount of capital the simulated strategy has at a specific moment, including profit or loss from the open position. The MarginRequired is the capital the account needs to sustain the position. Once the CurrentEquity is not enough to finance the open position, a Margin Call event will occur.
The formula for CurrentEquity is PriceChange * Direction * PointValue * AbsPositionSize + InitialCapital + NetProfit, where:
- PriceChange is the difference between the current price and the entry price of the open position.
- Direction is 1 if the position is long or -1 if it's short.
- PointValue is the amount of money that a whole number price move signifies. For most symbols, the value is 1, with the main exception being futures, where a change from 100 to 101 may mean that the value changed by 50 USD instead of 1 USD, in which case the PointValue will be 50.
- AbsPositionSize is the size of the current position. This value is always positive, even though strategy scripts represent short trades with negative numbers on the chart.
- InitialCapital + NetProfit is the strategy's total equity amount before opening the current position.
The formula for MarginRequired is LastPrice * PointValue * AbsPositionSize * (MarginPercent / 100), where LastPrice is the chart price for the calculation, and (Margin Percent / 100) is the coefficient we multiply by to get the account holder's required portion of the open position.
To demonstrate these calculations, imagine that we simulate a strategy with 1,000 USD as the "Initial capital" and a "Margin for long positions" value of 20% (5:1 leverage) to buy 40 shares of NASDAQ:GOOG at the price of 100 USD.
If the stock's price dropped to 95 USD, the CurrentEquity is PriceChange * Direction * PointValue * AbsPositionSize + InitialCapital + NetProfit = (95 - 100) * 1 * 1 * 40 + 1000 + 0 = 800, and the MarginRequired is LastPrice * PointValue * AbsPositionSize * (MarginPercent / 100) = 95 * 1 * 40 * 0.2 = 760. The strategy can still sustain the open position at this price, so no Margin Call event occurs.
Then, suppose the price declined further to a value of 90 USD. The new CurrentEquity value is (90 - 100) * 1 * 1 * 40 + 1000 + 0 = 600, and the MarginRequired is now 90 * 1 * 40 * 0.2 = 720. Since the CurrentEquity is no longer enough to cover the MarginRequired, the strategy creates a Margin Call event and forcibly liquidates part of the position.
Visualizing the margin price
The easiest way to visualize the price at which a Margin Call event can occur is to use the `strategy.margin_liquidation_price` built-in variable in the strategy's Pine Script™ source code. Adding this line of code to any Pine Script™ v5 strategy will display the liquidation price as a blue line on the chart:
plot(strategy.margin_liquidation_price)If there is a need to calculate the price manually, one can transform the equation from the previous section into the following formula:
MarginLiquidationPriceRaw = ((InitialCapital + NetPofit) / (PointValue * AbsPositionSize) - Direction * EntryPrice) / (MarginPercent / 100 - Direction)
The resulting MarginLiquidationPriceRaw value is then rounded up (for short positions) or down (for long positions) to the nearest price divisible by the symbol's minimum tick value.
Notice how the whole expression is divided by (MarginPercent / 100 - Direction). If the direction is Long and the MarginLong% is 100, the divisor will be 0, and the resulting MarginLiquidationPriceRaw will not be attainable due to division by zero. This behavior is consistent with the notion that a broker cannot forcibly liquidate a Long position with a margin of 100%.
With the hypothetical strategy described in the previous section, this calculation will result in: ((1000 + 0) / (1 * 40) - 100) / (20 / 100 - 1) = 93.75, which is the first price that will warrant a margin call. Since 93.75 is divisible by GOOG's tick size of 0.01, rounding based on the minimum tick has no effect in this scenario.
Note that the Margin Call event is not guaranteed to trigger at this calculated price during the simulation.
Calculating the size of the liquidation
The precise amount of a position liquidated by a Margin Call event depends on the price where it occurs. As noted above, the broker emulator liquidates four times the amount required to cover the loss, providing a cushion to ensure these events don't trigger in rapid succession. We use the following algorithm to calculate the liquidation amount:
1. Calculate Money Spent, i.e., the capital spent on opening the position.
Position Size * Entry Price
2. Calculate the Market Value of Security (MVS).
Position Size * Current Price
3. Calculate the Open Profit. If the trade direction is short and Open Profit is a positive number, the result should still be negative, so we multiply the absolute value of our calculation by -1.
ABS(MVS - Money Spent) * -1
4. Calculate the Equity, i.e., the capital available in the simulation.
Initial Capital + Net Profit + Open Profit
5. Convert Margin Percent to a Margin Ratio.
Margin Percent / 100
6. Calculate the Margin, i.e., the amount required in the account to cover the trader's part of the open position.
MVS * Margin Ratio
7. Calculate Available Funds, i.e., the amount of lost money the trader can't cover with their current equity.
Equity - Margin
8. Calculate the total amount of money the trader has lost.
Available Funds / Margin Ratio.
9. Calculate how many shares, units, etc. the strategy would need to liquidate to cover the loss. We truncate the value to the same decimal point as the minimum contract size for the current symbol.
TRUNCATE(Step #8 / Current Price)
10. Calculate how many shares, units, etc. the broker will liquidate to cover the loss. Our emulated broker sells four times the necessary amount to ensure a Margin Call event isn't constantly triggered if the losses continue. This value will be positive for short trades because the broker buys units to cover the loss instead of selling them.
Step #9 * 4
To examine this calculation in detail, let's add the built-in Supertrend Strategy to the NASDAQ:TSLA chart on the "1D" timeframe and set the "Order size" to 300% of equity and the "Margin for long positions" to 25%:
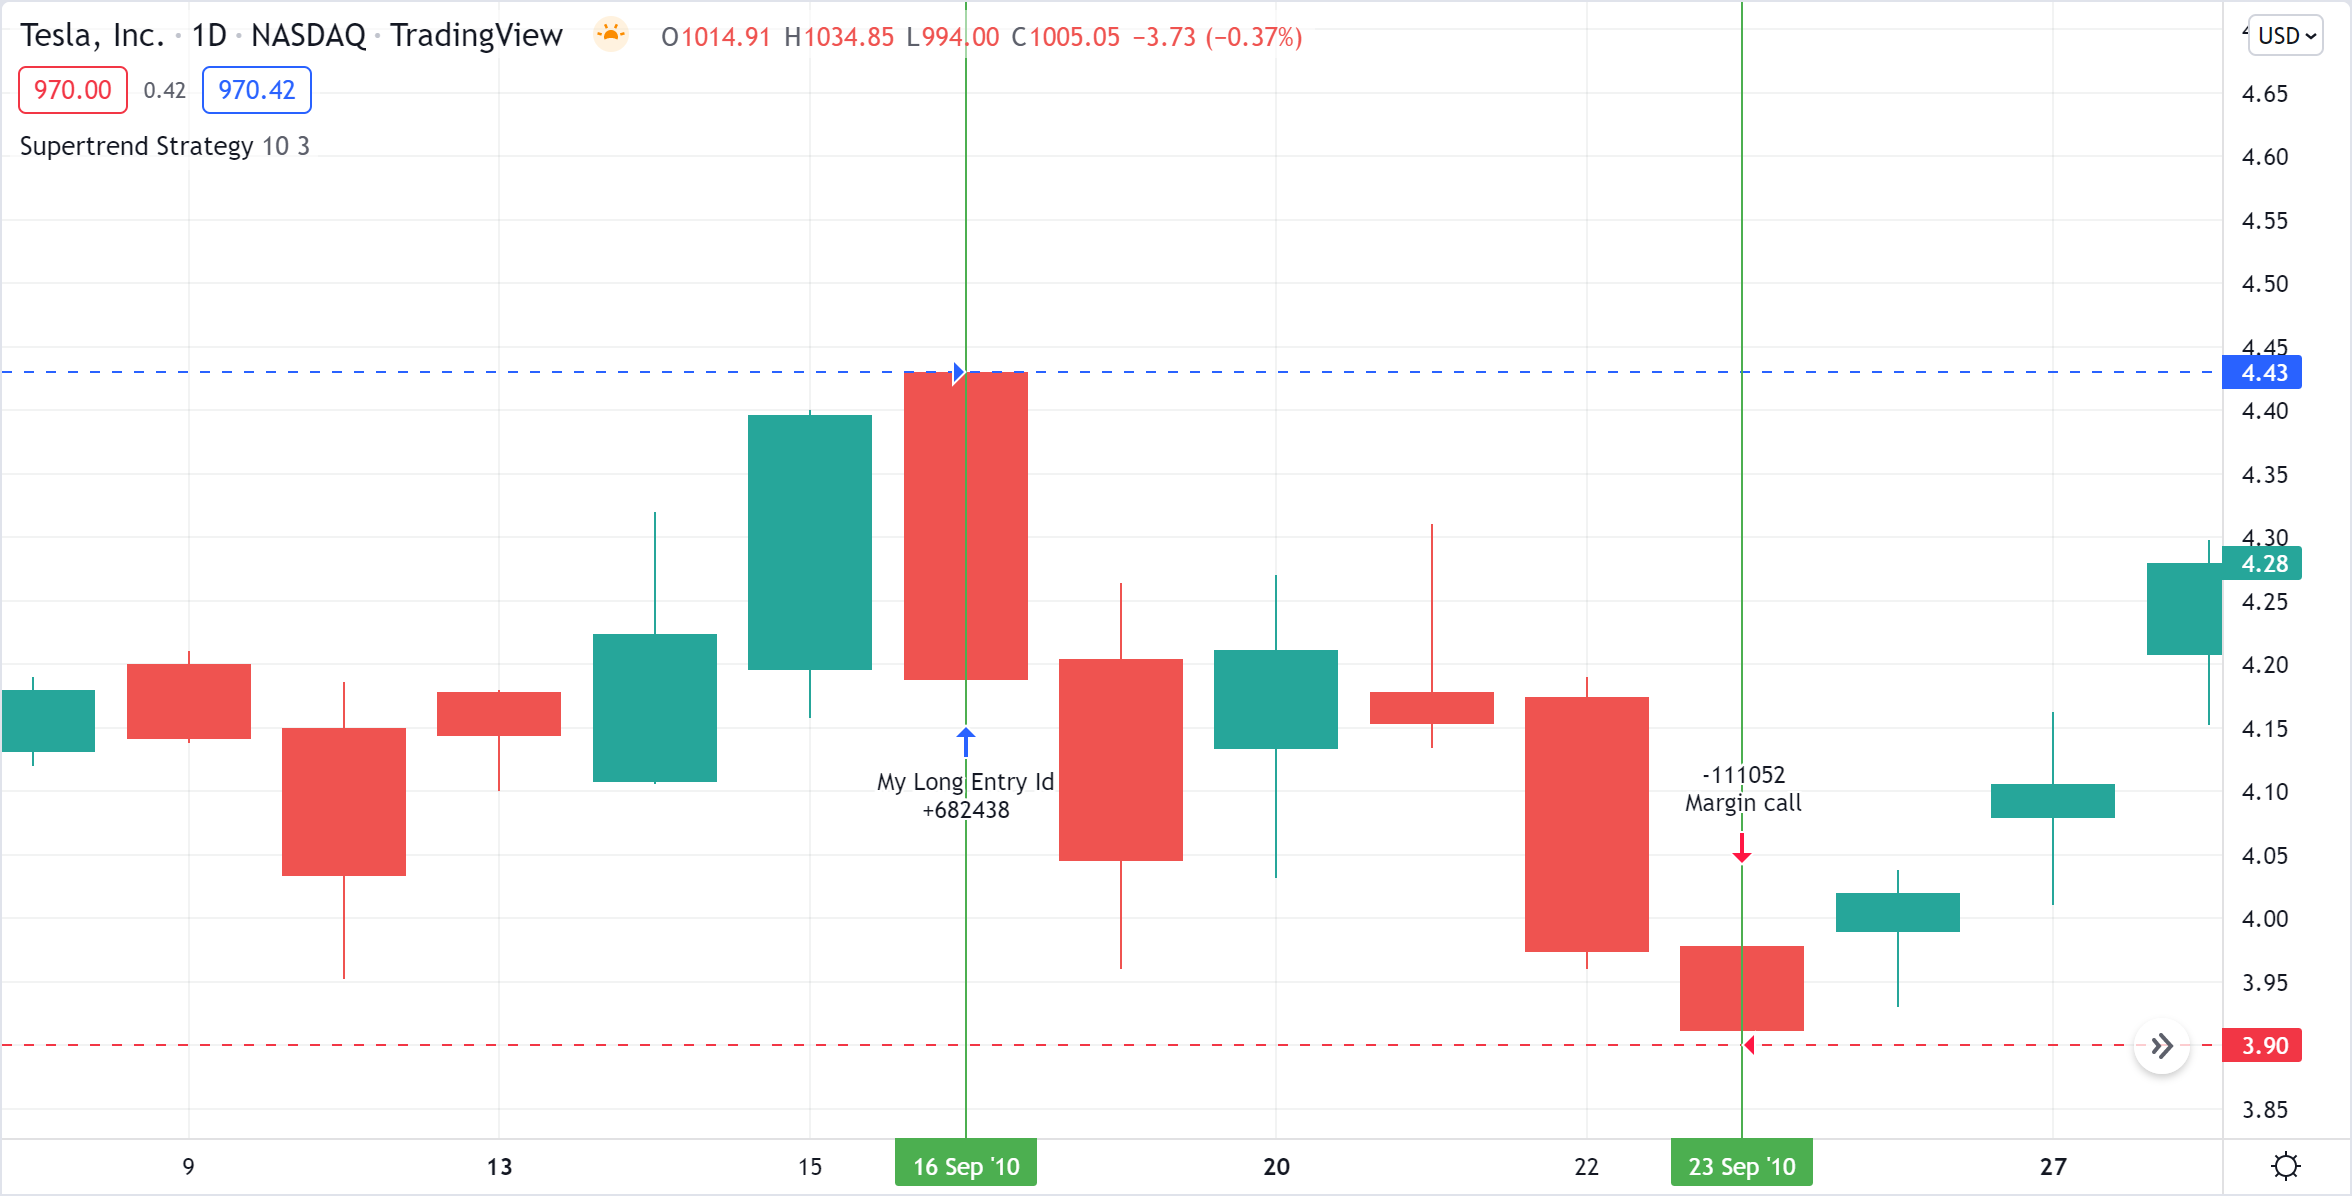
The first entry happened at the bar's opening price on 16 Sep 2010. The strategy bought 682,438 shares (Position size) at 4.43 USD (Entry price). Then, on 23 Sep 2010, when the price dipped to 3.9 (Current price), the emulator forcibly liquidated 111,052 shares via the Margin Call event.
1. Money spent: 682438 * 4.43 = 3023200.34
2. MVS: 682438 * 3.9 = 2661508.2
3. Open Profit: −361692.14
4. Equity: 1000000 + 0 − 361692.14 = 638307.86
5. Margin Ratio: 25 / 100 = 0.25
6. Margin: 2661508.2 * 0.25 = 665377.05
7. Available Funds: 638307.86 - 665377.05 = -27069.19
8. Money Lost: -27069.19 / 0.25 = -108276.76
9. Shares to cover the loss: TRUNCATE(-108276.76 / 3.9) = TRUNCATE(-27763.27) = -27763
10. Margin Call Size: -27763 * 4 = - 111052