XAUUSD (GOLD), bull get a power. Growth to 2372Hi friend. Bulls just formed powerful accumulation zone "1" and we have upward trend to 2364, 2372. Follow me. And read previous idea.
Futures market

Daily live trade with XAUUSD in 15m/30m/1h 20240528Daily live trade with XAUUSD in 15m/30m/1h 20240528

Intraday Trading Strategy for Gold: Navigating Price Movements In the displayed chart of Gold Spot versus U.S. Dollar, there are indications that after a bullish daily close, the price of gold is likely to attempt a retest of the resistance level. From the image, we can see that the 'Buy' level has already been taken at 2,350.292, while the 'Breakout' level is noted at 2,358.323. This suggests there is sufficient momentum to push the price towards higher resistance levels.
Above the 'Buy' level, several 'Take Profit' levels have been set at 2,364.385, 2,367.416, 2,371.963, and 2,378.784. This indicates a prepared strategy to capitalize on profits at specific price points as the price ascends.
The 'Stop Loss' level is set at 2,346.195 to mitigate risk in case the market moves against the prediction. This approach reflects a cautious risk management strategy while still optimizing the potential for profit from bullish market movements.
This entire setup reflects a well-thought-out trading strategy, with planning to maximize potential gains while limiting losses, which is crucial in commodities trading like gold.

Silver Buy SignalOn the 1-hour timeframe, buying begins, marking the end of the downtrend. The first sign of upward movement is observed. The price revisits the previous low with low volume but is unable to break lower, indicating selling pressure is absorbed by buyers. There is evidence of buyer accumulation for an upward movement, and smart money starts to buy at low prices. Signs of strength emerge as demand outweighs supply.
I am waiting for the price to go back to 30.678 for candlestick confirmation for my entry.
Entry: 30.678
Take Profit: 32.108
Stop Loss: 30.219

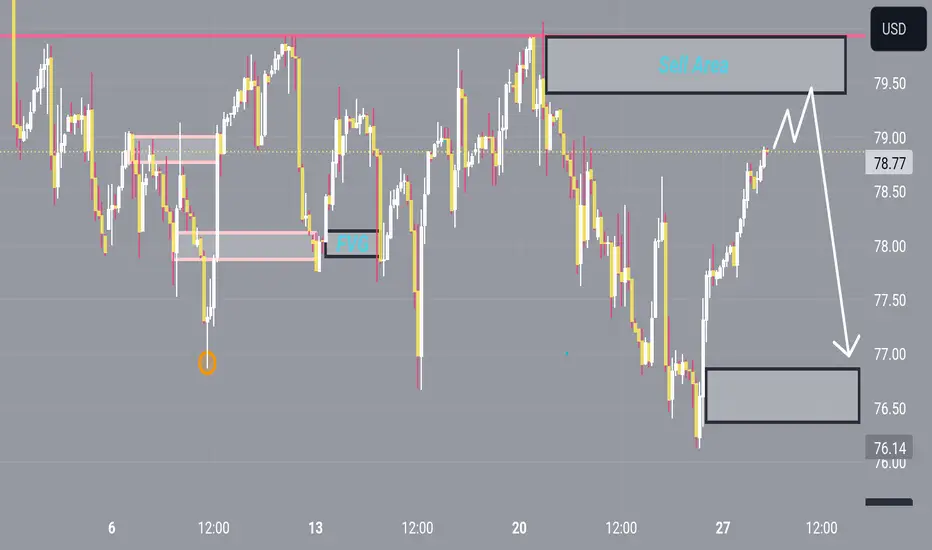
USOIL sell side Hey there on 2hTF the USOIL has looking today sell scenario can be retest from 79.00
79.50 can there again slip downside continue will looks for next support 77.50
GOLD TEST 2370Hey there on 2hTF the Gold have looking for bullish in this movement and will continue to see upside above of 2370-2375 level
So we can also looking for another resistance support from 2383 and will see again above 2400


XAUUSD - Price Action - Today's Key Zones - London/NY SessionToday's potential trades for #XAUUSD -
XAUUSD
It's almost 90 pips between today's support/resistance zones. If there's no breakout, we have enough room to trade within these prices, on the smaller time frames with care
If there is a breakout of today's support/resistance zone, it will come at the levels in the photo

RTY Ascending Wedge - Short IdeaRTY is looking good for a short if the market doesn't keep rallying. It'll be one of my top watches for short setups. I included a path for longs as well, but this chart is bearish for now so I'd expect the bearish path.

gold bearBased on the information provided, the current sentiment for gold appears to be bullish:
The easing dollar is supportive of higher gold prices.
The anticipation that the U.S. inflation data might lead to rate cuts by the Federal Reserve is also bullish, as lower interest rates typically boost gold prices.
The recent rise in both spot gold and U.S. gold futures indicates positive momentum.
Overall, the factors mentioned suggest a bullish outlook for gold in the near term.
this is not a financial advice!!!

Gold/USDA bullish flag is a technical analysis pattern that suggests a continuation of the prevailing uptrend. It's characterized by a strong price rise (flagpole) followed by a consolidation phase (the flag), which forms a rectangular or parallelogram shape that slants slightly downward. Here's a breakdown of the pattern:
1. **Flagpole**: The initial strong and sharp upward movement in price, showing a clear bullish trend.
2. **Flag**: A period of consolidation where the price moves within a narrow range, often downward or sideways, forming a flag-like shape. This represents a pause in the trend as traders take profits or the market digests the prior move.
3. **Breakout**: The price breaks out of the flag's resistance level, signaling the continuation of the uptrend.
Identifying a Bullish Flag
- **Trend**: Look for an established uptrend.
- **Flagpole**: Identify a strong upward movement in price.
- **Flag**: Observe a consolidation period with price movement within a downward sloping channel or a rectangle.
- **Volume**: During the formation of the flagpole, volume typically increases, then decreases during the flag's formation, and increases again at the breakout.
Trading the Bullish Flag
1. **Entry Point**: Enter a long position when the price breaks above the upper boundary of the flag.
2. **Stop Loss**: Place a stop loss below the lower boundary of the flag to manage risk.
3. **Take Profit**: Set a target based on the height of the flagpole added to the breakout point.

Gold M30 BullishHello traders as per yesterday trade our gold target hit in take profits! Today I am seeing the bullish momentum in gold and a good buy will come from 2344 area from a good support and my target is 150+ pips let's make some cash together!

Can the HOUSE be skilled and catch this Counter Trend SHORT...?CME_MINI:NQ1!
“Never give up, never give in, and when the upper hand is ours, may we have the ability to handle the win with the dignity that we absorbed the loss.” -Doug Williams
As I've been studying PA on the Daily TF, it seems as if we have finally hit exhaustion in the market for buyers as their job may have been complete. I was lookin at a Potential SHORT that the HOUSE may be able to capitalize on... Here's what I would like to see in PA in order to enter SHORT...
1) As 1Hr Demand Zones build up & Supply Fails, The first level of demand I need to see fail is pricing around ($18678.00) which would indicate the first sign that sellers may be present and could be ready to start the Market Correction...
2) Once we get the first 1Hr Demand Failure and we get confirmed candle closures underneath pricing ($18678.00), I want to see sellers push price down towards Daily Support Level ($18623.00)...
3) This is a very important Key.....Once we get to the Daily Support Level ($18623.00) There is a huge 1Hr indecision candle rii underneath that level that I want to see sellers push price deep into and have confirmed candle closures inside the 1Hr Candle and underneath Daily Support Level...
****I need to see sellers present with confirmed candle closures under the Daily Support Level on the 30m TF and below in order for to me place my limit...
4) If and when we can get the sequence of events to take place in PA then I will be compelled to go SHORT playing the retest of Daily Support Level pricing around ($18623.00) & targeting the resting SSL below / 1Hr demand zone EQ pricing around ($18490.50) roughly around 530 pts in our favor!!
5) This is a counter trend SHORT so we need to be very skilled in our approach... Lets stay focused!! *** Almost forgot Price needs to be trading underneath the RED V-WAP in order for me to enter SHORT as-well as a last min. cherry on top confirmation!!
Remember when it comes to FRM (Financial Risk Management) our job is to manage the downside costs of printing High side returns of $$$ consistently... Let's Step!!
Stay Focused & Reach Excellence!!
#BHM500K #NewERA #Champions

GOLD PLAN 05/28Support: 2335 - 2322 - 2316 - 2307 - 2290
Resistance: 2368 - 2379 - 2384 - 2397
Breakout and retest:
- Demolition and closure on 2354 - 2361 - 2374
- Break and close below 2335 - 2322 - 2316
🔴SELL price range 2378 - 2380 stop 2384
🟢BUY price range 2336 - 2334 stop 2330 (scalping)
🟢BUY price range 2309 - 2307 stop 2303
Scalping strategies will be applied when the resistance - support areas above have entry signals.
Note: Full TP, SL to be safe and win the market‼️

Elliott Wave Analysis Expects Nasdaq Futures (NQ) Continue HigheShort Term Elliott Wave in Nasdaq Futures (NQ) suggests the rally from 4.19.2024 low is in progress as an impulse. Up from 4.19.2024 low, wave ((i)) ended at 17949 and dips in wave ((ii)) ended at 17386. The NQ extended higher in wave ((iii)) with internal subdivision as another impulse in lesser degree. Up from wave ((ii)), wave (i) ended at 18348 and dips in wave (ii) ended at 18165. Wave (iii) ended at 18760, wave (iv) ended at 18545, and wave (v) ended at 19023 which completed wave ((iii)).
Wave ((iv)) pullback did a zig zag Elliott Wave structure. Down from wave ((iii)), wave (a) ended at 18802 and pullback in wave (b) ended at 18933. Final leg wave (c) completed wave ((iv)) at 18621 low. The future rallied again in wave ((v)) ending an impulse as wave (i) of ((v)) at 18956 high. Near term, as far as pivot at 18621 low stays intact, expect a correction in 3 or 7 swings in wave (ii) before resuming to the upside in wave (iii) of ((v)). It expects short term upside in ((v)) towards 19117 – 19270 area as minimum extension, while dips remain above 18623.85 low. Alternatively, it can do double, if break below 18623.85 low as ((iv)) before turning higher.

GOLD - gold price cannot cool down yetForecast
Lukman Otunuga, leader marketplace analyst at FXTM, predicts that with buyers presently having a bet on simply one Fed price reduce in 2024, the marketplace can be tilting in a bearish direction.
Lukman Otunuga stated that if the May PCE file is launched better than marketplace forecasts, this will deal every other blow to expectancies of Fed hobby price easing, inflicting gold expenses to fall even deeper.
But analysts expect that traders are nevertheless having a bet on gold expenses to boom withinside the close to future. Forecasts say that with the aid of using the give up of the week, gold rate will boom to 2,375 USD/ounce./.
----------------------------

USOIL: Short-term oil prices are on the way to recovering to $80USOIL: Short-time period oil fees are at the manner to convalescing to BSE:EIGHTY because the marketplace is presently watching for the subsequent OPEC+ meeting. However, the chance of a lower is fantastically excessive due to the fact OPEC+ nations have nearly all showed the growth in production. This will probably reason oil fees to drop even lower. Consider ready to promote with USOIL around BSE:EIGHTY with the anticipated goal to go back to $75-76

Massive Running Flat Silver MacroRunning flats are rare, but extremely bullish. 3 wave A down from $48 into a 3 wave B that takes out the high of A, finishing with a 5 wave C that wicked below $12 at 85% the length of wave A. First target is $120

SELL XAUUSD for trend reversal SELL XAUUSD for trend reversal
update
STOP LOSS : 2,379
From the movement is showing a possible trend reversal because more of the traders trading with the trend are already existing there trade positions , and on the daily time frame there is already signal of regular divergence which indicates a possible trend reversal too...
there is a bigger chance of a possible reversal from this level...... you are free to contact me directly here and i will respond to all questions
TAKE PROFIT : take profit will be when the trend comes to an end, feel from to send me a direct DM if you have any question about take profit or anything
Remember to risk only what you are comfortable with…….trading with the trend, patient and good risk management is the key to success here

Gold trading strategy today, uptrendToday's gold price is trading at 2,352 USD/ounce, a sharp increase of 18 USD compared to the previous day's opening price of 2,334 USD/ounce.
World gold prices fluctuated in the context of data from the Commodity Futures Trading Commission (CFTC - US) showing that gold investment funds increased their buying positions by 194,000 contracts.
This information can make many investors expect the gold market to heat up. Therefore, they took advantage of putting capital into this precious metal. Gold price today has upward momentum.
On the other hand, the world geopolitical situation becomes more complicated as the military conflict between Israel and Hamas forces becomes increasingly tense. Since then, many financial institutions have increased their need to shelter capital in gold. Today's increase in gold prices in the world is understandable.

GOLD increases - geopolitical tensions and FED interest ratesAccording to analysts, the USD weakens best withinside the brief term. More importantly at the prevailing time, the gold marketplace is popping its eyes to the May US non-public intake expenditure index (PCE) record to be posted on June 1.
Most professionals accept as true with that this index will boom greater than formerly forecast, making the time to reduce hobby quotes via way of means of the United States Federal Reserve (Fed) more and more more distant.
Therefore, CEO Marc Chandler of Bannockburn Global the Forex market found out that valuable metals have become very unstable for owners, inflicting traders to more and more more depart and now not be interested by the gold marketplace. .
In addition, the lower in gold call for from Chinese traders and the easing of the effect of geopolitical dangers after the helicopter crash that killed the Iranian President also are damaging factors. for valuable metals.
Gold charge forecast
Lukman Otunuga, leader marketplace analyst at FXTM, predicts that with buyers presently making a bet on simply one Fed price reduce in 2024, the marketplace can be tilting in a bearish direction.
Lukman Otunuga stated that if the May PCE record is launched better than marketplace forecasts, this will deal some other blow to expectancies of Fed hobby price easing, inflicting gold costs to fall even deeper.
But analysts expect that traders are nevertheless making a bet on gold costs to boom withinside the close to future. Forecasts say that via way of means of the cease of the week, gold charge will boom to 2,375 USD/ounce.

27TH MAY GOLD ANALYSIS1. Introduction
Gold prices are highly influenced by various global economic factors, including the demand from major economies such as China. As a member of BRICS (Brazil, Russia, India, China, and South Africa), China's economic strategies, including its moves to create a new currency to counter the US dollar, significantly impact gold prices. Currently, there are indications that the strength of buying gold in China is decreasing, which could have implications for the gold market.
2. Current Market Situation
As of today, we have identified two key selling zones for gold:
Sell Zone 1: $2347 - $2350
Sell Zone 2: $2365 - $2370
3. Impact of China's Gold Buying Strength
China has been a major player in the gold market, with its buying strength often acting as a significant support for gold prices. However, recent reports suggest a decrease in China's gold buying. This reduction can be attributed to several factors:
Economic Slowdown: China's economic growth has been slowing down, impacting its investment in commodities, including gold.
Policy Shifts : Changes in China's monetary policies and a focus on diversifying its reserves may also lead to reduced gold purchases.
BRICS Currency Initiative : As BRICS aims to create a new currency to challenge the US dollar, China may be reallocating its resources and strategic focus away from gold.
4. Implications for Gold Prices
The reduction in gold buying from China can lead to several potential impacts on gold prices:
Decreased Demand: With China being a significant buyer, a reduction in demand can lead to downward pressure on gold prices.
Market Sentiment: Market participants often take cues from major economies like China. A perceived lack of interest from China can result in bearish sentiment among other investors.
Geopolitical Factors: The BRICS' initiative to create a new currency may also introduce uncertainty and volatility in the currency and commodity markets, influencing gold prices.
5. Trading Strategy
Given the current situation, traders should consider the identified selling zones for potential trade setups:
Sell Zone 1 ($2347 - $2350): This zone represents a near-term resistance level where sellers might be active. Traders can look for bearish signals to enter short positions around this area.
Sell Zone 2 ($2365 - $2370) : This higher resistance zone could offer a more favorable risk-reward ratio for selling, especially if gold prices make a significant move upwards before facing resistance.

XAUUSD- Gold price cannot cool down in the short termGOLD nowadays is going for walks above the 235x zone. With this rhythm, on body D1, I see that the candles are going for walks absolutely above the MA. In addition, as on Zoom final night, I additionally stated that Gold will without difficulty react barely with the parallel resistance location at 2356>2360.
>If at this Beat Gold will increase strongly thru this Zone, it's miles probable that Gold will growth strongly once more with the aid of using 238x.
Today you may confer with Canh Buy GOLD round 2348>2352
SL 2346
TP 2360>237x.
Surely Gold can have mild declines. But for now, nowadays I will observe the primary Trend`s Plan to trade. If there's any new information, I will replace greater everyone ❤️❤️
