OIL will going up around 83Oil will going up aroung 83, Buy now.
we can see Oil has Descending Braodening Wedge Pattern.
XTIUSD trade ideas

WTI Crude Oil Price Shows Bullish Trend Ahead of OPEC MeetingWTI Crude Oil Price Shows Bullish Trend Ahead of OPEC Meeting
As the chart indicates, on Monday, the price of WTI crude oil rose by approximately 1%.
Reuters reports that the bullish sentiment is driven by:
→ the upcoming OPEC+ meeting scheduled for 2 June;
→ expectations of high fuel demand with the start of the summer driving season and holiday season in the US.
Conducting a technical analysis of WTI crude oil on 10 May, we drew an ascending channel in blue and suggested a scenario of continued price growth within this channel.
Since then:
→ the price formed a low on 15 May at the level of 76.35, but quickly recovered from it. Thus, the bears' attempt to break the low of 8 May at the level of 76.68 quickly failed. In other words, there was a false breakout of the 8 May low.
→ A similar pattern occurred on 24 May – the price dropped below the 15 May low of 76.35, but quickly recovered.
Two false bearish breakouts are a bullish sign. And the strong behaviour of WTI crude oil prices on Monday confirms this.
Analysing the XTI/USD chart today, it is important to note that:
→ the price movement in April-May forms a descending channel (shown in red);
→ this decline since 5 April may be a correction within the larger ascending blue channel;
→ the price quickly returned to the blue channel, briefly dipping below its lower boundary;
→ the price is near the upper boundary of the descending channel.
Thus, conditions are being created for the end of the corrective movement. The bears' inability to hold the WTI oil price at new lows may be used by the bulls to resume the upward trend. It is also possible that news related to the OPEC+ meeting will contribute to this development.
Start trading commodity CFDs with tight spreads. Open your trading account now or learn more about trading commodity CFDs with FXOpen.
This article represents the opinion of the Companies operating under the FXOpen brand only. It is not to be construed as an offer, solicitation, or recommendation with respect to products and services provided by the Companies operating under the FXOpen brand, nor is it to be considered financial advice.

Soon there will be huge market fluctuationsHello everyone
I agree with my friends who want to learn investment techniques and knowledge. Personally, I believe that investment friends should improve their abilities during the investment process, use their own technical knowledge to analyze and operate, and enjoy it, falling in love with the investment instead of fearing it. Fear is due to lack of strength and judgment. What I always recommend is to slowly learn and master commonly used technical indicators (moving averages, MACD, KDJ, support levels, resistance levels, etc.) in the process of guidance, combined with fundamentals to analyze market trends and specific operating points, and gradually Improve your comprehensive analysis skills and exercise your mentality. Grow up slowly and step by step. After all, investing is a long-term process. So I bring my investment friends to follow this principle, and I will teach you to start from the basics.
1. Go short at $74.75, stop loss 35 points, and take profit $72.50. (More aggressively, you can go short at $74.30)
2. If the Asian and European market falls below $73, use a 30-point stop loss at $72.70 to go long to $74.70.
3. If the short position in strategy 1 is stopped, then go short again at $75.55, with a stop loss of 30 points and a profit stop of $73.50.


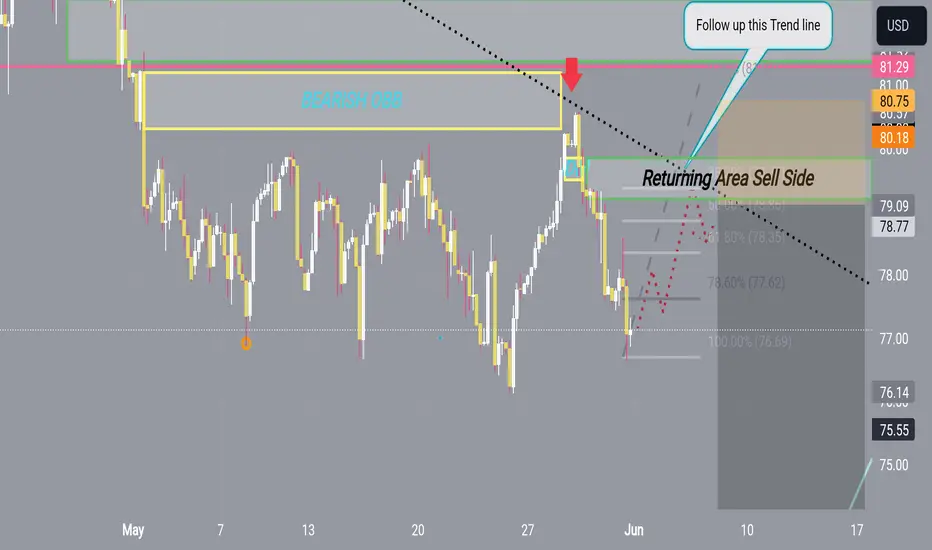
Should we wait for lower oil prices?
In the analysis of the oil chart, the main trend line of the upward movement (blue line) has been broken, and the broken candle is marked with an arrow. It seems that we have to wait for lower prices for oil.
Do you agree with my opinion?

Short Crude OilOn Daily Chart and 4H chart we created the megaphone(broadening formation) so I would check the top boarder of the formation and look for breaking market structure.

USOILRSI indicates Bullish Divergence. Which means that at any time the market trend can change to HH and HL.
Order type : buy stop
Entry : 78.82
SL : 77.38
TP1 : 78.82
TP2 : open

Oil Prices Rally from a Six-Week NadirOil prices increased early on Thursday, recovering from a six-week low after a significant 3.6% fall the previous day, which was the lowest point since mid-March. This drop was attributed to an unexpected surge in U.S. stockpiles, indicating softer demand than anticipated.
At the same time, market observers have pointed out that the Federal Reserve has kept interest rates steady, diminishing earlier expectations for a rate cut. PVM Oil Associates commented, "The reduction in borrowing costs may not occur as soon or as quickly as previously thought. It is similar to peak oil demand—consistently anticipated yet never realized."
Technically:
The price has stabilized within the bearish zone, having already breached the pivotal range between 80.73 and 82.24. This suggests a continuation of the bearish trend, with potential targets at 77.14 and 75.35. A further break below 75.35 could lead the price down to 69.78.
Conversely, if the price stabilizes above 82.24, it may indicate a bullish trend, potentially reaching up to 86.86.
Pivot line: 80.73
Support lines: 77.14, 75.35, 69.78
Resistance lines: 82.24, 86.86, 89.08

Usoil buyUsoil looking perfect time to buy in cheap price 1:2 RR 200 pips target in this analysis keep calm keep hold

USOIL DROP CONTINUE Hey there on 4hTF the USOIL has Looks After Reach Out 78
Then We Can Also set our Mind in Sell Area
So If you are looking for again short then entry 78 and hold 73

WTI Crude Oil: LONGToday's session marks the beginning of the bullish move higher to test the April 2024 WTI highs. The ultimate target seems to be around the 85.00 - 87.00 region. This move begins now and may possibly extend to the end of June or early July.
The stop loss should be around the at least be 77.90.
Stay tuned for updates.

AUD/NZD Short and WTICO/USD ShortAUD/NZD Short
Minimum entry requirements:
• Tap into area of value.
• 1H impulse down below area of value.
• If 2 touch 15 min continuation, 5 min risk entry within it, or reduced risk entry on the break of it.
WTICO/USD Short
Minimum entry requirements:
• If 3 touch 1H continuation or 2 touch 1H continuation with 3 touch structural approach, 15 min risk entry within it.

WTI oil, final leg down
OWN OPINIONS. NOT FINANCIAL ADVICE
WTI has just broken the 200 week SMA to the downside. On the daily, lost the 200 day SMA, backtested and failed (very bearish sign). If MAs arenot recaptured in the very short term it might get very ugly.
Also, the YTD AVWAP has been a magnet for price action. Once lost, it's gone directly to the next level at 1STD (currently at 74.10$). If also broken, the next AVWAP 2 STD support is in the 70$ area.
First price target is around the 70-72$/barrel , where the rising trend line meets the falling short term channel, possibly touching the 261% fibo extension of the 1st short term trend impulse. IF those big support areas were to be lost, then 65-67$ is the long term pivot point

USOil moving lower**Monthly Chart**
Last month candle closed bearish after testing the low of key reversal candle of the previous month and started moving lower. The next target on monthly is around 71 level and then 63 level respectively.
**Weekly Chart**
Last week's candle closed as a bearish key reversal suggesting a continuation of the downtrend move.
**Daily Chart**
USOil broke the relative equal high of the range with the creation of manipulation candles at around 80 levels. The next target is to break the soft level of supports around 75.50 level and move aggressively lower. A corrective move around 78.00 level is required to push the price lower. The next target is around the 72 to 70 level.

Crude oil-retesting supportCrude prices are softer again this morning, with the market continuing with the weakness we saw in the latter half of last week. Yesterday, meetings between OPEC and OPEC+ members concluded much as expected, with the groups agreeing to extend their existing production cuts into next year. The extended output cuts include those voluntary ones agreed by Saudi Arabia and Russia. Oil producing countries remain concerned about the outlook for future demand growth, particularly as expectations for rate cuts from the US Federal Reserve have been pushed back significantly since the beginning of this year. Both Brent and WTI are retesting the lows hit just over a week ago with prices back to levels from which they rallied sharply. As far as front-month WTI is concerned, that saw crude jump from just above $76.00 to just under $80.50 in the space of four trading days. Will history repeat, or will prices break down further from current levels?

USOILWe can attempt to buy USOIL from specified level as it break LH , also bullish divergence occur indicate that it move upward .
SL , TP mention in chart.

US/UK OILClear descending wedge on a weekly/daily structure, looking for a retest of previous resistance for entry. Break on trend line or 8 daily ema may mean a change of trend

crude oilCrude oil is currently on main wave B of an A,B & C correction, pair has completed sub-wave A & now its currently on towards sub-wave B is about to be confirmed as pair is expected to breakout towards minor-wave 5 of sub-wave C on main wave B

USOIL Downtrend Line Rejection At $78.11 31.05.2024- USOIL downtrend line rejection at $78.11 on 30-minute chart
- If rejection holds, likely drop to $77.44
- Break below $77.44 could lead to $75.53
- If rejection fails, potential rise to $78.63
- Break above $78.63 could push price to $79.00
- Apply Risk Management
_____________________________________________________________________________
Risk Warning: Trading in CFDs is highly speculative and carries a high level of risk. It is possible to lose all of your invested capital. These products may not be suitable for everyone, and you should ensure that you fully understand the risks taking into consideration your investment objectives, level of experience, personal circumstances as well as personal resources. Speculate only with funds that you can afford to lose. Seek independent advice if necessary. Please refer to our Risk Disclosure.
BDSwiss is a trading name of BDS Markets and BDS Ltd.
BDS Markets is a company incorporated under the laws of the Republic of Mauritius and is authorized and regulated by the Financial Services Commission of Mauritius ( FSC ) under license number C116016172, address: 6th Floor, Tower 1, Nexteracom Building 72201 Ebene.
BDS Ltd is authorized and regulated by the Financial Services Authority Seychelles (FSA) under license number SD047, address: Suite 3, Global Village, Jivan’s Complex, Mont Fleuri, Mahe, Seychelles. Payment transactions are managed by BDS Markets (Registration number: 143350)

Crude oil prices resumed their rise,The short-term trend of crude oil (1H) is volatile, and the oil price is back below 80. The moving average system diverges downward, and the short line objectively trends downward. The subjective trend oil price has been hitting new lows and is in the downtrend rhythm of the main trend. In the morning, the oil price was in a narrow range near 77.90, the bear momentum is still dominant, and it is expected that crude oil will further decline during the day to test near 77.
Today: 78.50 short, Stop loss: 79.40, target 77.20.

CRUDE OIL LONG FROM SUPPORT|LONG|
✅CRUDE OIL is going down now
But a strong support level is ahead at 75.55$
Thus I am expecting a rebound
And a move up towards the target at 78.17$
LONG🚀
✅Like and subscribe to never miss a new idea!✅

Crude oil continues to run in the 77~80 rangeCrude oil continues to run in the 77~80 range, waiting for a breakthrough, continue to sell high and buy low
Crude oil technical analysis
Daily resistance 79-80, lower support 76.8
Four-hour resistance is 79-80, and support below is 77-76.8
Crude oil operation advice: Crude oil was under pressure at the 79.2 mark yesterday and ushered in a weak and volatile downward breakthrough. The Asian and European prices fluctuated sideways and came under pressure near the 79 mark, then fell back and fell rapidly, falling back to a weak rebound near 78.2. NY time was under pressure at the 79 mark and ushered in an accelerated decline. Finally, the price fell to around 77.6 and stabilized.
The overall price appears to be suppressed at the 79 mark. Short-term oil prices continue to show a daily red-green cycle rhythm. Today, the lower support focuses on 77.2-77, and the upper pressure focuses on 79.5-80. The day will continue to rely on this range to maintain a wide range of long and short shocks. The watershed between short-term long and short strength still focuses on the 80 integer mark. Before the daily level reaches 80, it will continue to maintain long and short shocks between 77 and 80.
BUY:77.0 near SL:76.70
BUY:76.8 near SL:76.40
BUY:79.6 near SL:79.30
Technical analysis only provides trading direction!
