NAUKRI trade ideas

#NAUKRI - Looks strong to buyNaukari Stock Analysis.
(This view is only for study purpose)
1. Its about form 3 T pattern.. (Please note this is my first attempt to find this pattern it may be wrong)
2. Its has been consolidating in large sell off market. Mean may be institutional accumulating this stock.I do not have evidence yet to confirm that.
3. Volume is drying from its peak to till date.
4. Most its trading from above 200, 150 from mast 9 Months. Its show its strength in it.
5. 150 DMA is crossed from 200 DMA.
6. Its not above 50 DMA.
So Plan is very simple.
1. Wait 2280 Price level.If is above 2280 then buy with 10 % of capital.
2. SL will be around 5 % of last pullback low which is 2068 around.
3. Target - Initially looking for 10-15 %. If success then will keep trailing SL.

breakout AT NAUKRIthe price is breaking out of the trend. ore upside. specially on a day when the markets are down


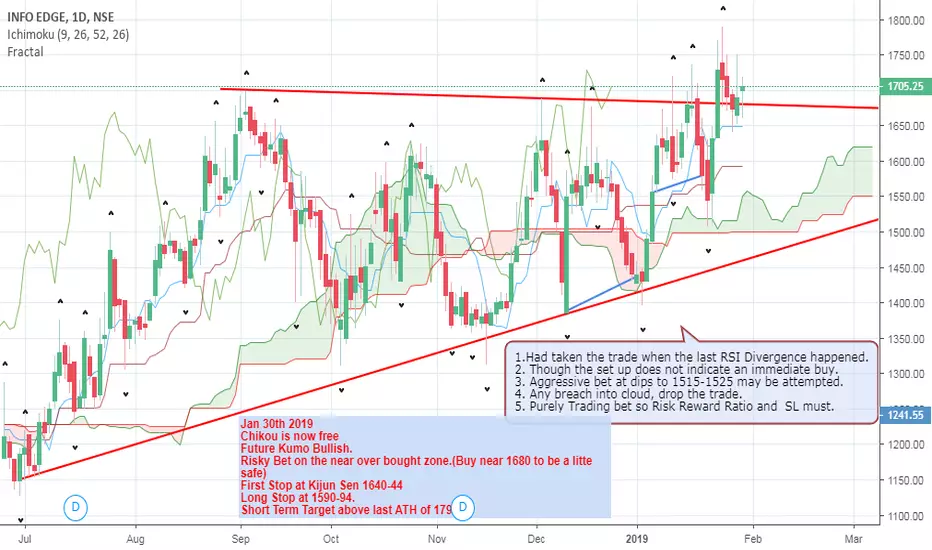
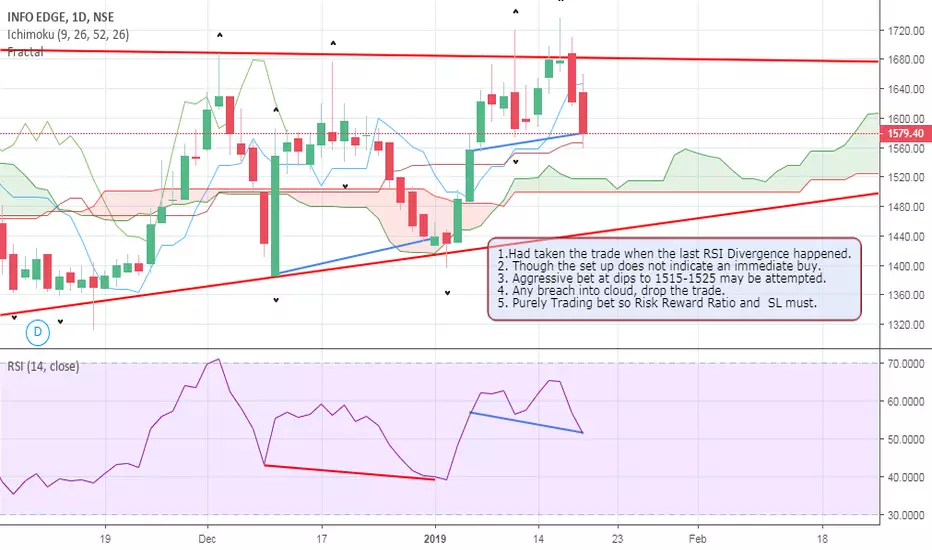
NAUKRI - INFO EDGE - RISK THE TRADEENTER AROUND 1670-80. RISKY TRADE AS TRADING NEAR ALL TIME HIGHS. REST MENTIONED ON THE CHART.
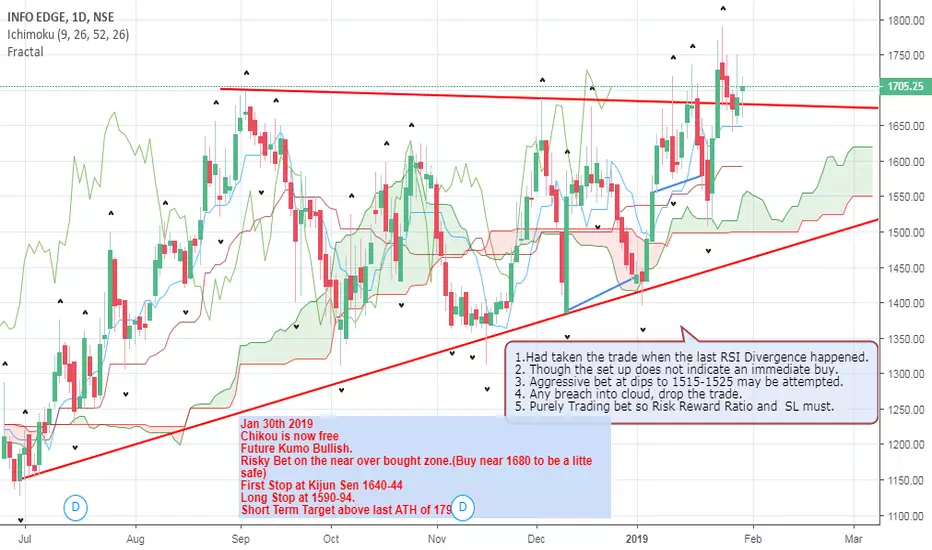
Naukri - Info Edge - Risky TradeA high Risk Trade can be tried with stricter SL, All mentioned in the chart.
Since it is in the uptrend so one can wait for 1670-80 for an entry.
#NAUKRIWeekly C > 1414.50 and H >1500 with strength required
For a Target to 1616 / 1793 in 3-5 weeks
CCI(W/M) crosses 100
