GODREJCP trade ideas

Godrej CP LONG140 Qty per Rs. 100K -
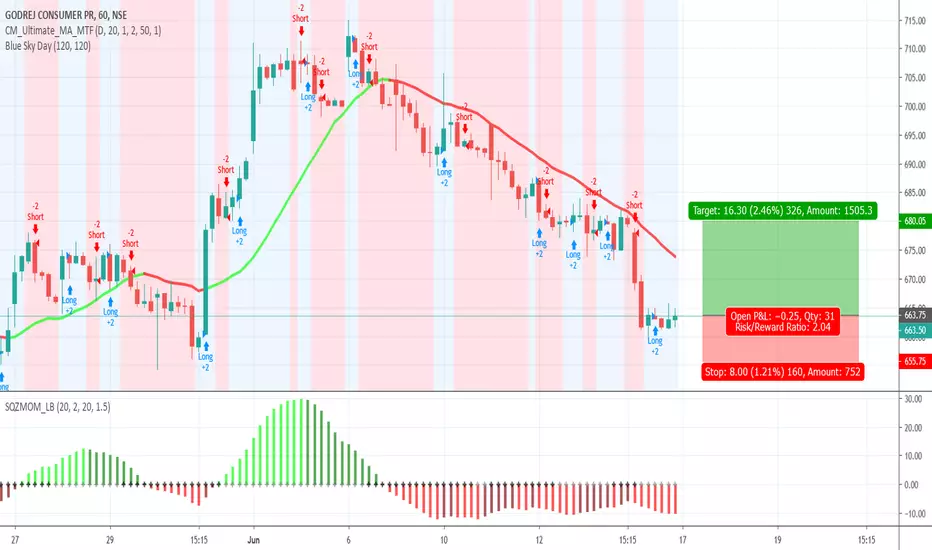
Risky as the price may go further down before reversing. I am happy to take another long if this SL hits

GODREJCPStock was trailing downward since march and found good support. Stochastic is in favor. Pattern is also bullish.
Buy above 646 Target = 650, 653, SL = 641
#Illuminati

BUY GODREJ Consumer PR (Swing Trade)Premise:
Bullish divergence w RSI forming on D3
Bullish Swing failure pattern
Failed to close below support / high value node.
Setup:
Long at current market price
Targets marked starting w 709
Stop under 626.5
Risk to reward - 4.5


#GODREJCP Bullish bat and ABC complete#GODREJCP is a long candidate for me. Its has completed the "abc" correction and with the Bullish Bat #harmonic it should be ready for its next leg up for. It has also formed sort of a double bottom here.


Bullish breakout in Godrej Consumer Godrej CP seems have a bullish breakout and a long trade can be initiated here.

GodrejcpBuy 1302, Trgt 1325-30, SL 1298.
Buy 1351-2, Trgt 1361-5, SL 1344.
Rationale: Strong uptrend, FMCG, Consolidating in a small range, strong OI Put support at lower levels.

Godrej Consumer - A tale of trapped bulls stopped out!The stock seems to be breaking out of a good rangebound Cup and Handle after trapping longs in the previous break out! Can it sustain this time, let's see! The structure seems complete and strength could be seen in the counter going ahead!


GodrejCP, 100 DMAPosted this study a couple times. Failed Harmonic Shark. Price corrected and took support at 100 DMA. Price now is reaching the crucial resistance zone. It is possible that a breakout may occur in a couple of days.

GodrejCP, SharkHave posted this study. Price is reaching the resistance level which coincides with a probable formation of Shark Pattern. Logical target is earmarked.
Strong bullish stocks do correct, since traders book profit. It does not mean that trend has changed. Correction in price and trend change are not to be confused. Smart traders will wait with lot of patience for the right time and opportunity displayed by price pattern.

GodrejCP, 200 DMAWhat a chart! What a trend! No explanation required. It is buy on dips. And booking profits. Wait for dips to buy again. Anything simpler than this?

Godrej CP - LongThe short and mi term EMA's are bunched and long term EMA's are moving upwards,
IHNS pattern is formed.
Enter once it breaks the neckline

GodrejCP | Blast Is NearBuy Above 943 or near 938 with SL below 936. Targets are highlighted on Chart ie 970 and 1000+

Godrej CP - LongMid term EMA looks to be 50D
If it breaks the trend line support on CBSL, enter once the price is around 50D EMA.

Godrej CP - LongMid term EMA looks to be 50D.
If it breaks the trend line support on CBSL, enter once the price is around 50D EMA.


