XRAY vision tells me it’s a good co/franchise No edge at this moment fundamentally but good co at decent valuation and good technical spot to set a 3pt stop loss or perhaps buy some call leaps on it
XRAY trade ideas

XRAY- Going LongLooks like XRAY respected my support line on the monthly and looking very bullish as today's daily candle breaks resistance and closes just bellow. Also note the doji on the trend line where the 8 crosses over the 20 & 40 EMAs. 1st Target price 41.60 and the 48.80.

[XRAY] Possible phase 1The price lost force. The 30MM is starting to has a declining slope. The RSI is starting to increase.

[XRAY] phase 4 -> Don't buy yetThe price is going down and it's below 30MM for $7.96 yet. The RSI is so low. Don't buy yet. We'd wait some time.


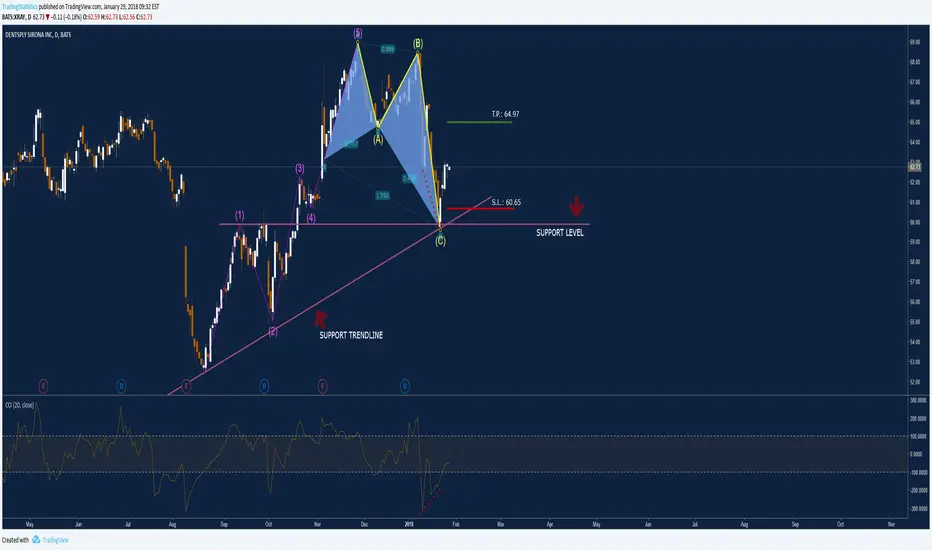
XRAY Long OpportunityAn intraday high potential, Back Tested Long Analysis.
We ll try to find an entry price within the expected pull back zone 62.84 - 62.00 as previously being back tested.
We ll try to enter into the correction of the downtrend movement tracking trend oscillators as below:
CCI diverges the price crossing down the zero level as well as shown in the chart.
A butterfly pattern occurs confirming the correction.
The end of ABC corrections signaling the uptrend movements.
Supporting levels meet close to 60.00$ psychological point.
DETAILS ON THE CHART
NOTE: Entry range area above the entry point, is calculated upon 80% of the recorded pullback back tested past performances
DISCLAIMER: This is a technical analysis study, not an advice or recommendation to invest money on.

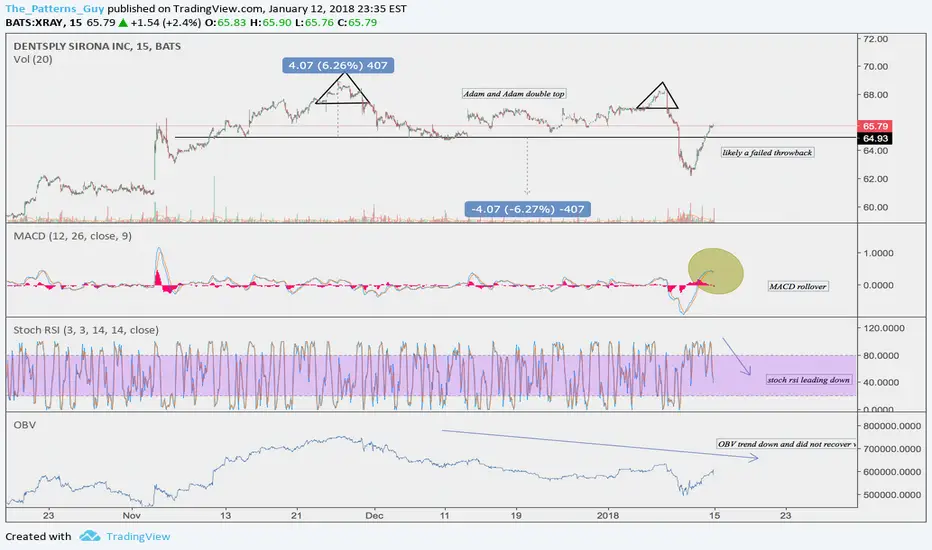
$XRAY #short #intraweek #idea I usually do daily or higher charts, but if found this nice double top on the 15 minute chart. Note are in the chart. Notice the throwback on the right. It looks like it failed. I expect the stock to head south. One note of caution. I peaked at the options chain. The bid and ask spreads are kind of wide. Really think twice about execution.


X RAY potential day tradeTried this one earlier in the day and lost an R. Brad loved the gap. Trying it one more time. Could also wait for this candle to close and then play the ESR pattern.

XRAY clears 2007 highFor just over a year XRAY has been trying to break through the 2007 resistance of $47.84. During this time a double bottom chart pattern formed on the weekly chart - which can be a strong indication of a continuation of the previous up trend.
Since breaking through the $50 resistance zone in early November, price has retraced to test this line (with resistance becoming support) and an early opportunity to buy soon followed. This may have been too early for longer-term trend traders but the next set-up to enter should be considered.


