NAS100 trade ideas


NAS100 ANTICIPATIONReason for nas100 to drop it is being that now
1.we are in a bearish trend as the market changed structure
2.Market gave bearish confirmation through CHOCH and BOS
3.Market is sitting on an Order block on 30m TFM
4.Reversal conformation on 30m OB for bearish continuation

NAS100: Inside DayHi everyone and welcome to my channel, please don’t forget to support all my work subscribing and liking my post, and for any question leave me a comment, I will be more than happy to help you!
“Trade setups, not movements”
1. DAY OF THE WEEK (Failed Breakout, False Break, Range Expansion)
Monday DAY 1 Opening Range ✅ Day 3 cycle
Tuesday DAY 2 Initial Balance
Wednesday DAY 3 (reset DAY 1) Mid Point Week
Thursday DAY 2
Friday DAY 3 Closing Range
2. SIGNAL DAY
First Red Day
First Green Day ✅ (possible variation of FGD considering Thursday as a dump day)
3 Days Long Breakout
3 Days Short Breakout
Inside Day ✅
3. WEEKLY TEMPLATE
Pump&Dump ✅
Dump&Pump
Frontside ✅
Backside
4. THESIS:
Long: primary, taking in consideration the Thursday dump, there are high chances to too this market going to stop the trader short from HOW.
Short: secondly the previous LOW hasn't been completely stopped yet, the market can trap volume to retest that level, however, I'm pretty neutral with the bias, giving a little bit of more priority to the FGD (because is the most recent price action)
Please note that the purpose of my analysis is to help me and you hunting the best trade setup for the day, none of my technical aspects are a way to forecast any directional market movement.
Gianni

US100 BUYNasdaq is at final buy zone worthy position use sl ...
If break the point never look for buy
Trail sl every 35 pips

NAS 100 TargetsUsing Fibs, Channels, EW, and Full/New Moon Cycles I predict what could be the first target and date then where it could be by the election.

The price fell despite strong NVDA earnings. What's the cause?Nasdaq Falls 2.0% Amid Investor Uncertainty and Fed Caution
The Nasdaq fell by 2.0% on a subdued Thursday as investors adjusted their portfolios amid shifting market sentiment. The trading session was marked by an uneasy atmosphere following the release of the Federal Reserve's latest meeting minutes, which indicated that central bankers are in no hurry to reduce interest rates .
This cautious stance from the Fed has been a key factor in supporting the recent upward trend in stocks.
Technical Analysis:
The Nasdaq is poised to test the 18,715 level before likely retreating to 18,600. A bearish trend will be confirmed if the price stabilizes below 18,600, potentially driving it down further to 18,435. Conversely, a bullish scenario will emerge if the price breaks above the 18,660 threshold.
pivot line: 18710
Resistance Price: 18790, 18920, 19100
Support price: 18550, 18440, 18250
Its range for Today will be between Support 18250 and Resistance 18790

US100US100 just broke the last HL.
Just enter the bearish trend.
Bearish divergence also form .
we sell at CMP.

NAS100: First red day on the backside moveHi everyone and welcome to my channel, please don’t forget to support all my work subscribing and liking my post, and for any question leave me a comment, I will be more than happy to help you!
“Trade setups, not movements”
1. DAY OF THE WEEK (Failed Breakout, False Break, Range Expansion)
Monday DAY 1 Opening Range
Tuesday DAY 2 Initial Balance
Wednesday DAY 3 (reset DAY 1) Mid Point Week
Thursday DAY 2 ✅ Day 3 cycle
Friday DAY 3 Closing Range
2. SIGNAL DAY
First Red Day ✅
First Green Day
3 Days Long Breakout
3 Days Short Breakout
Inside Day
3. WEEKLY TEMPLATE
Pump&Dump ✅
Dump&Pump
Frontside
Backside ✅
4. THESIS:
Long: N/A I'm not interested in any long setup, neither counter trending the backside on Thursday
Short: primary, market on the backside move, dumping down with nice bearish momentum. Lower low placed into the LOW, looking for a sell high opportunity at 9:30am NYO or 10:01am after major red news release.
Please note that the purpose of my analysis is to help me and you hunting the best trade setup for the day, none of my technical aspects are a way to forecast any directional market movement.
Gianni

Swing UpwardsThis market is getting back on it's continuous upward trend since the year 2020. Now is the best time to swing trade, invest, look for the lowest entry and continue to buy.

NAS100 Bullish wave On the macro - nas 100 is currently in a bullish elliot wave
observing previous years/months its looking like the peak of the 3rd leg will be around july 2024 then retrace down until october 2024 when it will create the 4th leg to take it higher for the rest of the year into next year
Paytience pays

NAS pullback, then correction towards 500I´m expecting Nas to climb back above 700. 700-740 looks as an ideal resell area. Yesterday we have entered at 832 and TP all trades at 600, so lets try to repeat it again. I will try to update this idea when-if entry conditions are met. If you follow me, you wont miss anything. Wish you good luck.
P.S. I´m not a signal service, however I´m sharing signals. Don´t have 30K followers (consisted mostly from bots), so it is up to you to check what idea are you trading. Check my previous ideas to know. Instead of waiting for signals, invest(your time, not money) into your learning. It will be more profitable, more interesting for you.

NASDAQ Pair : US100 - Nasdaq
Description :
Completed " 12345 " Impulsive Waves
Break of Structure
RSI - Divergence
Exp FIAT as an Corrective Pattern in Short Time Frame
Fibonacci Level - 261.8%

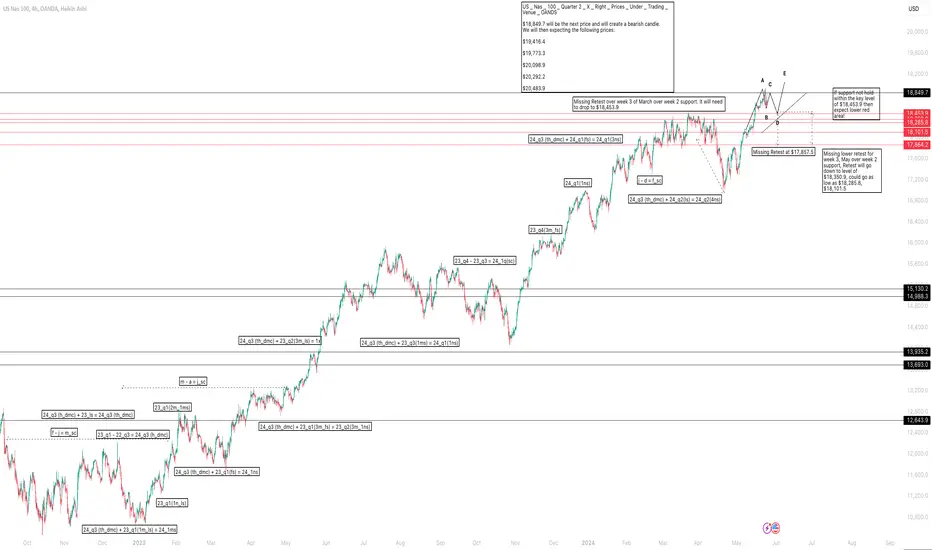
US _ Nas _ 100 _ Quarter 2 _ X _ Right _ Prices _ Under _ TradinUS _ Nas _ 100 _ Quarter 2 _ X _ Right _ Prices _ Under _ Trading _ Venue _ OANDS
$18,849.7 will be the next price and will create a bearish candle.
We will then expecting the following prices:
$19,416.4
$19,773.3
$20,098.9
$20,292.2
$20,483.9
QQQ Q2 24 FORECAST (RE ENTRY)First entry failed (rare case senario)
so here is a more detailed chart with alternative entry points
where i expect reversal even tho ive been crying wolf (recession crash) im not
looking for it just yet but market doesnt wait for anyone now does it
maybe it may lead to a retracemnt for bearish continuation ill update for interested parties

#Nazdaq #Nas US100Analyzing the NASDAQ chart, $18,700 stands out as a key resistance level. We are also observing a divergence in the RSI, which often signals a potential reversal. My analysis suggests that after the price consolidates within the range of $18,570 to $18,700 for several days, we could see a downward movement towards $17,500. Following this decline, I anticipate the start of a new uptrend, targeting $19,250.

US100 dropas we are expecting fundimentals in about an hour, im seeing a drop in nas100 in anticipation to break the previous low.


NASDAQ - NDX Critical SituationNASDAQ needs a fresh High above 18908 to negate the Engulfing Bearish Candle!
The last engulfing candle drove the market down for two weeks, how about now?

Nasdaq Index Shows Uncertainty Ahead of PCE ReleaseNasdaq Index Shows Uncertainty Ahead of PCE Release
The main event of the week is the release of the Personal Consumption Expenditures (PCE) index, which the Federal Reserve particularly focuses on when assessing inflation in the US. The release is scheduled for Friday at 15:30 GMT+3. As this important event approaches, rumours and trader expectations about the news increasingly impact the current price on the stock market.
According to ForexFactory, the Core PCE Price Index on a monthly basis is as follows:
→ forecast for Friday = 0.3%.
→ previous value (a month ago) = 0.3%;
→ value two months ago = 0.3%.
These figures indicate stable inflation, but surprises are not ruled out, which could certainly lead to a spike in volatility.
The price of the Nasdaq index (US Tech 100 mini on FXOpen) has decreased since the beginning of the week – this may indicate market participants' uncertainty about whether inflation will decrease. Meanwhile, as CNBC reports, the president of the Federal Reserve Bank of Minneapolis, Neel Kashkari, believes that the Fed should wait for significant progress in combating inflation before lowering interest rates.
In his opinion, rates could potentially even be raised if inflation fails to decrease further. “I don’t think we should rule anything out at this point,” Kashkari added.
Technical analysis of the Nasdaq index (US Tech 100 mini on FXOpen) chart shows that:
→ the price is in an uptrend (shown by the blue channel);
→ the 18840 level is acting as resistance (indicated by the arrow).
Note the behaviour of the Nasdaq index price (US Tech 100 mini on FXOpen):
→ the upward impulse A→B was sharp, but it failed to hold above the 18840 level;
→ the upward impulse C→D is less sharp, judging by the slope of the trajectory. After overcoming the 18840 level, the price formed a rounding pattern (a sign of demand deficit) and decreased (confirmation of weakness). Notably, the price did not reach the upper boundary of the channel (shown by the red circle).
Today, the price is near the median line of the ascending channel, which could lead to some consolidation in anticipation of the news. If the news indicates a slowdown in inflation, we might see a new attack on the 18840 level; otherwise, the Nasdaq index price (US Tech 100 mini on FXOpen) could decrease to the lower boundary of the current channel.
Trade global index CFDs with zero commission and tight spreads. Open your FXOpen account now or learn more about trading index CFDs with FXOpen.
This article represents the opinion of the Companies operating under the FXOpen brand only. It is not to be construed as an offer, solicitation, or recommendation with respect to products and services provided by the Companies operating under the FXOpen brand, nor is it to be considered financial advice.

Looking for a continuation of todays bearsIf price gives me confirmation on the lower time frame I will look to sell. If this is the weekly pivot then price should trend down for at least today ad some of tomorrow.

little lateI was doing some groceries, but it seems bulls have been awaken hahahaha.
Buy buy buy
Flat to long!
Have a blessed in the green close for everyone.

CHART BREAKDOWN NASDAQ: Key Levels, Targets and Thoughts!🎯Brief Description🖊️:
The chart provides insights into critical market levels, emphasizing an essential demand zone (low-risk buy zone) spanning from 18330 to 18315. Additionally, medium-risk sell zone between 18870-18920, respectively, are highlighted.
Things I Have Seen👀:
Important Demand Zone🟢: Identified between 18330 and 18315, serving as a low-risk buy.
Medium-Risk Sell Zone🟠: Noted between 18870 and 18920, suggesting another area with moderate risk for potential selling positions.
Bearish Targets📉:
18850: Possible retracement area.
18700: Possible retracement area.
18500: Area with laying low liquidity.
Ultimate Target: 18330- Essential Demand Zone
Bullish Targets📈:
18400: Possible retracement area.
18500: Possible retracement area.
18580: Possible retracement area.
18670: Area with a lot of liquidity.
What's Important Now❗
Currently, the crucial approach is to wait and observe the price action at this level. We need to assess how the market reacts before considering any decisive moves. Stay observant and responsive to real-time developments in the market.
