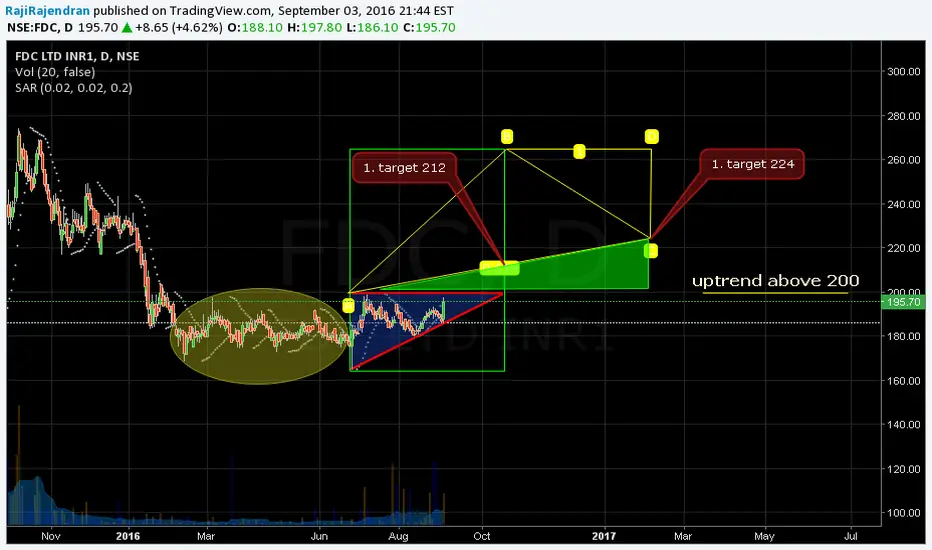
FDC LTDShort term trade:
Close this resistance level with good volume. Whereas technical indicator are bullish. More upside expected by resistance is 273.40 and 275.00
Support is 273.00 and 230.00 on daily chart frame.
FDC trade ideas


FDC EXPECTED TO START BULL PHASE FDC STOCK COMPLETES Correction on 4 hours pattern expect to outperform markets....can go long for target 430 in next 6 months for sl 325


FDCFDC
Neckline Breakout @ 317
Looks good to buy if sustain level above 317.
Target 325, 330.
Book Partial profit once achieve first target.
SL 309


FDC BREAKOUT ⬆️⬆️⬆️🔥🔥🔥🔥Fundamental Strong company FDC gave rectangle BREAKOUT Buy now@310 for short term target 410 or accumulate for long term.


LONG ON FDC LTDNow stock at a good retest zone, we can wait for a HH formation in 1hr time frame before buying.
Daily time frame showing RSI BULLISH DIVERGENCE.

#FDCA relatively riskier trade, but very attractive risk to reward ratio. It is currently testing its 2016 levels after giving a stellar breakout recently.
I entered yesterday at 280, with stoploss below 260 and target as ATH.

FDC on super bull runFDC is on a bull run after company's announcement of buyback @Rs.450/sh , the stock has shown massive growth technically respecting its narrowing upside wedge , the question now is that will it be able to give a breakout above its 5year divergent channel or will show resistance around 425 which has been indicated in my chart using trend lines NSE:FDC


R-0104 Short term cash buy FDC @ 277-278 TK cross over
ichimoku cloud break out
MACD cross over
TGT 295
SL 270

FDC breakout with volume - long @272 for 311 / 331 SL 254FDC breakout above Feb & Jan high with volume, closing at day high. There is resistance at 311, crossing above there could be big move. SL 254


FDC - LOOKING VERY BULLISHFDC
CMP 305
TARGET 360 PLUS
STOP 275
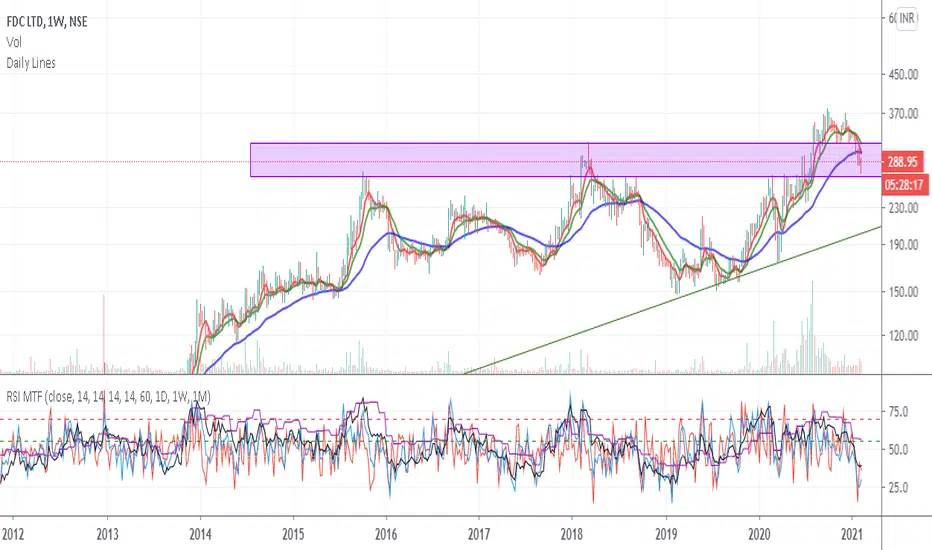
Weekly chart
1) Stock has cleared previous reistance with huge volumes.
2) Stock has had a long consolidation W pattern spanning several months, the range of which has been convincingly broken out.
3) Stock has the potential to move towards 360 plus in the coming weeks time.