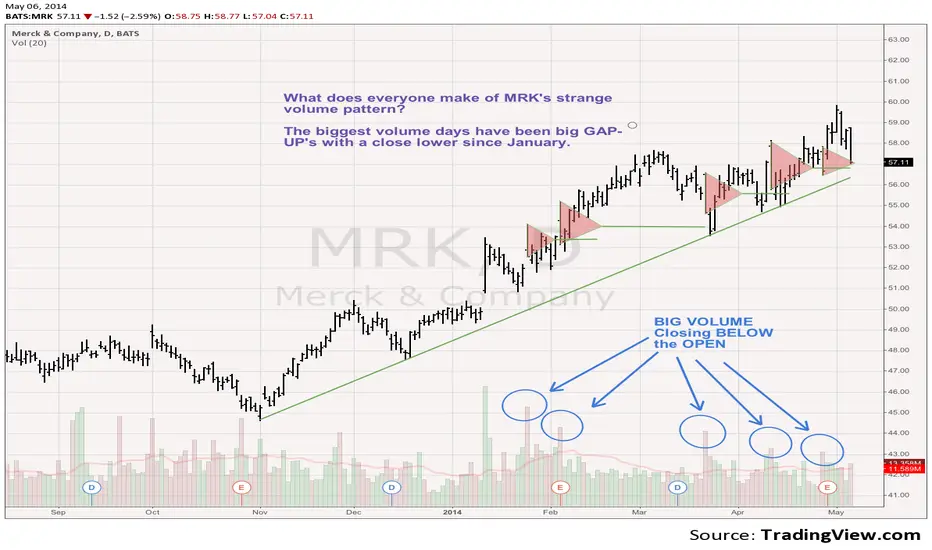
Merck MRK daily has 5 monster volume days where gap UP's then...What do you make of this pattern of volume in Merck MRK here on the daily chart?
Each time this has happened since January it has moved higher, but I think it is distribution by a massive seller, akin to the days of Jesse Livermore. It is so unusual that I'd have to say in my nearly 30 years of watching charts that I haven't seen a chart look like this before. If MRK can break under one of these support lines, then it could mark the end of this uptrend. Granted I don't see tremendous downside risk, perhaps 10% or so.
Strategy: Sell short going under 57 with a 59 stop. Target initially 54-53.
Tim 4:16PM EST, May 6, 2014 57.11 last -1.52
MRK trade ideas
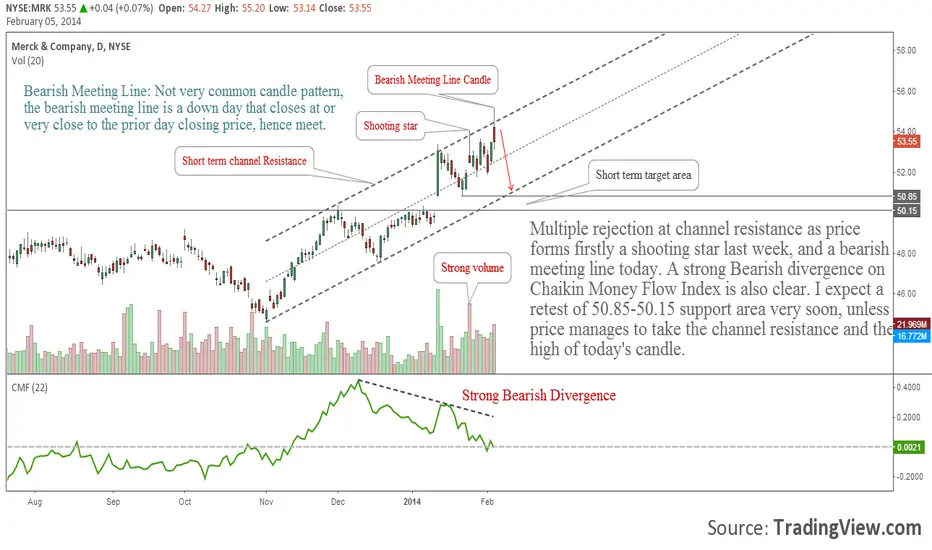
Merck & Co: Bearish Signals Multiple rejection at channel resistance as price forms firstly a shooting star last week, and a bearish meeting line today. A strong Bearish divergence on Chaikin Money Flow Index is also clear. I expect a retest of 50.85-50.15 support area very soon, unless price manages to take the channel resistance and the high of today's candle.
Bearish Meeting Line: Not very common candle pattern, the bearish meeting line is a down day that closes at or very close to the prior day closing price, hence meet.
Bull flag on MRKPretty basic formation. Remember to place the stop loss ,preferably below the spinning top which confirmed the breakout. Keep it simple :)

