METB34 trade ideas


Met life to target area 52-53 Met life analyzed to continue its uptrend to 52-53 area, stop loss on 49


MET with the whole swingWrite sometning about your psyhology thinking before trade? good day for trading, but be carefull not to trade too much
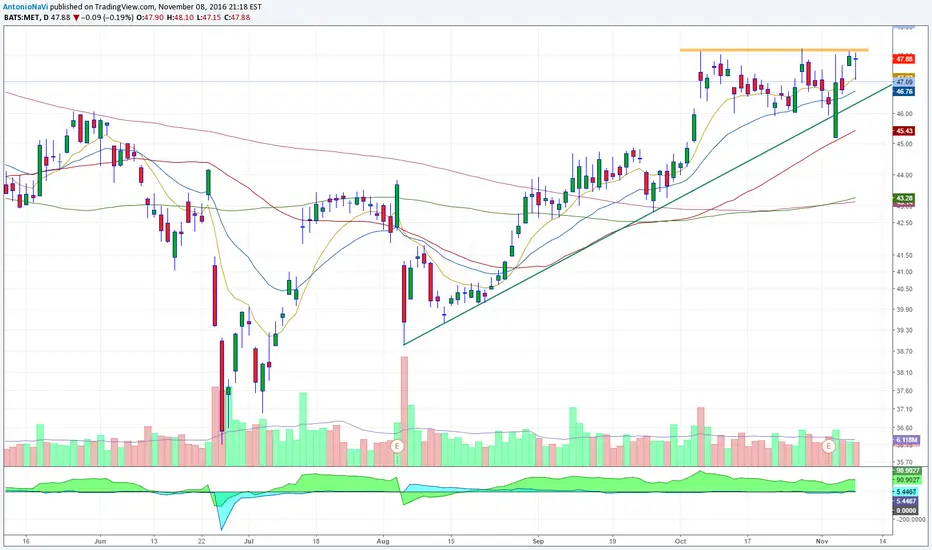
Describe the trade. What you see? clasical down wedge pattern I will play from lower support to upper resistance
What have I done well for this trade? enter point target and stop loss funcion in full in my favor
What can I take away to help with later trades? just made more such a trades

Fib RetraceMET, Set buy market stop order with other cancels other for target/stop, still learning.
Buy order: 51.30
Target: 52.90
Stop: 50.45
Time Frame: 14th of Feb

MET Short, bearish divergences RSI and MACD are bearishly diverging. Aroon has also given a sell signal. This is a short term swing trade.

MET Reversing HigherMet has retraced 52% of its rise from September 8, and looks poised to retest its November 2 high in the coming days.


MET analysis, Elliott Wave, Fib, wedgeMET seems to be going through a solid breakout from a downwards channel. This retracement has also occurred at 38.2%, allowing for decent upwards movement. There has also been an increase in volume in the past 2 days, allowing for the change in the direction of the price action. According to my Elliott Wave analysis, the stock is going through it's own middle of a 3rd wave that is part of a large new 3rd wave taking place (after a complete 1-2-3-4-5, A-B-C). There is also a rising wedge, or a triangle tilted upwards, in technical analysis, this indicates that the price will move lower. However, the stock is attempting to breakout towards the upper part of the triangle, rather than remaining on the lower area where it could continue to further downside. According to GuruFocus, there are issues with the stock's fundamentals, as revenue declines, debt increases, income decline, and other signs that the stock is approaching major resistance levels while dividends are at lows. The company has growth issues, along with problems in their financials. There are numerous large investors with high amount of shares in this company, however the majority of recent trades have been sales of their shares in the company. There are some buyers and investors increasing their amount of shares, but these trades can possibly be the necessary change in the share price to allow prices to continue on higher rather than falling too far to dangerous levels.
This analysis comes after Trading View user, 'pardis' has identified a breakout. I have not yet entered long, however I plan to attempt an entry which can lock in profits, while adding to the position later on. This may be considered 'picking tops and bottoms,' however with a day trading position rather than an 'investor outlook' on the company it isn't irrational to try an entry which may or may not work out.


Bears are out For MetLifeOn April 28, 2017, the MetLife 20 day moving average (DMA) crossed below its 150 day moving average (DMA). Historically this has occurred 24 times and the stock drops a minimum of 1.184%. The median drop is 3.894% and maximum drop is 10.709 % over the next 12 trading days.
When we take a look at other technical indicators, the relative strength index (RSI) is at 48.2268. RSI tends to determine trends, overbought and oversold levels as well as likelihood of price swings. I personally use anything above 75 as overbought and anything under 25 as oversold. The current reading declares the stock has been neutral but also trending down since the election last November.
The true strength index (TSI) is currently -9.0016. The TSI determines overbought/oversold levels and/or current trend. I solely use this as an indicator of trend as overbought and oversold levels vary. The TSI is double smoothed in its calculation and is a great indicator of upward and downward movement. The current reading declares the stock has been moving down for most of 2017.
The positive vortex indicator (VI) is at 0.8072 and the negative is at 0.9669. When the positive level is higher than 1 and higher than the negative indicator, the overall price action is moving upward. When the negative level is higher than 1 and higher than the positive indicator, the overall price action is moving downward. The current reading declares the stock has been moving down but with both indicators below 1, anything can happen.
The stochastic oscillator K value is 53.4444 and D value is 54.8659. This is a cyclical oscillator that is highly accurate and can be used to identify overbought/oversold levels as well as pending reversals and short-term activity. I personally use anything above 80 as overbought and below 20 as oversold. When the K value is higher than the D value, the stock is trending up. When the D value is higher that the K value the stock is trending down. The current reading declares the stock did not make it to overbought territory before recently reversing downward. The highs reached for the stochastic have been trending lower since the election, so a reversal at the current level is very possible.
Considering the moving average crossover, RSI, TSI, VI and stochastic levels, the overall direction appears to be pointing down. Based on historical movement compared to current levels and the current position, the stock could drop another 2.23% if not more over the next 12 trading days.


Metlife alive?Main signals:
1-Double bottom with oncoming breakout
2-Breakout of strong inclined resistance

$MET possible reversal to come$MET broke coil to downside on daily.
However, w/ the .618 fib touch, bounce, and break above the .5 and .382, could see a complete reversal here if we see a break of apex to upside, and still has major MA's above.
Could just be a retest, but gap still open above wedge.


MET dailyMetLife, Inc
Broken out from an 6 month ascending Triangle, within channel. Retested Breakout support. MACD bullish. OBV strong.
52wk Range: 45.52 - 56.87
Insurance Group Sector.
Target : 62
Stop: 54.50

