Top SHORT picks 9/12These 4 are my top Short ideas for today into the future until the price stays below the Red TrapZone.
The picks are based on momentum, volume and price action.
C1MA34 trade ideas

ZION,UMBA,WAL,CMA 5d 202303145 day snapshot of 5 regional banks after Moody's downgrade on Mar-14-2023 and collapse of Silicon Valley Bank and Signature Bank
ZION, UMBA, WAL, CMA

US Banking in turmoilFollowing the weekend banking crisis with Silicon Valley Bank, Silvergate and Signature Bank, we're seeing massive contagion risk as bank runs occur. Was the intervention by the FDIC, Federal Reserve Bank, and Treasury, enough to easy concerns?

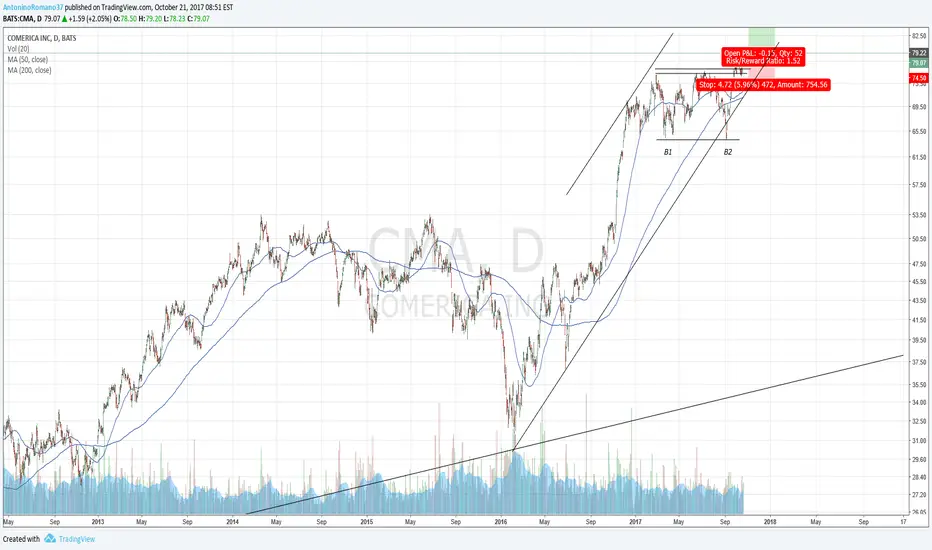
CMA - Bottom Within ChannelI have drawn a large channel in solid white
this is accompanied by a triangle structure but more importantly it as a double bottom for price
I have shown this double bottom with a bars pattern along the lower line of the triangle
This is where I think price will turn a recovery

Bearish divergence on CMA Daily and 4HWeekly (not shown):
Possible bearish divergence coming up. Impulse still green, but is shows prices around 101 were rejected and price closed much lower.
MACD-Histogram still rising, as well as EFI. sRSI declining, although it could cross.
Daily
Bearish divergence on MACD-H, MACD lines, EFI and even Stochastic RSI. Stoch RSI crossed bearish and comes from an overbough condition. Even an ATR channel divergence. Current bar shows an upwick and rejected the to close around the 101$ resistance
4H
Bearish divergence again on ATR lines, MACD-H and MACD lines, and EFI. sRSI is bearish and is declining.
Entry:
At this level, but first we need to see how the weekly opens.
98-99,5
Stop:
102
Target 1: 94,46
Target 2: 92,88

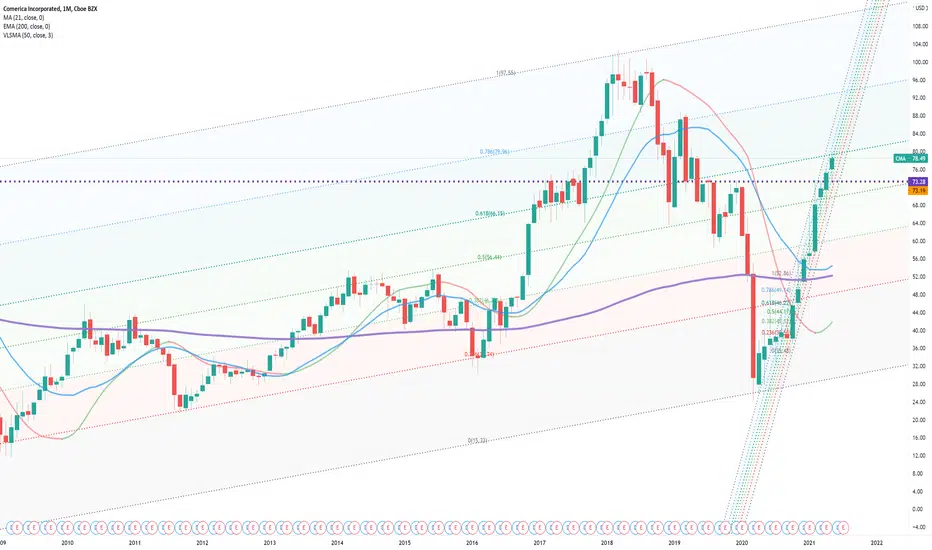
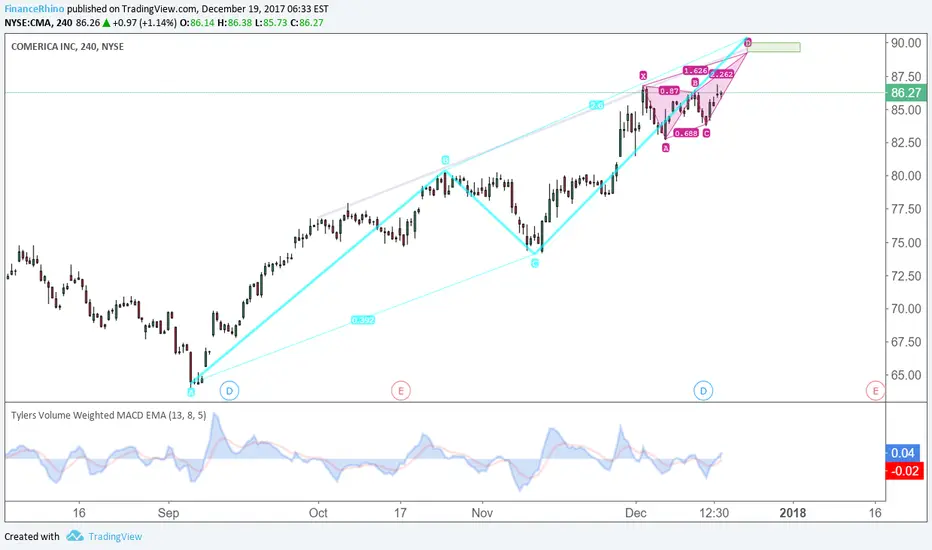
CMA - LONG - ZOOM-OUTOh, it's a long way home
It's a long way home
In the night alone
(Johnny Hallyday)
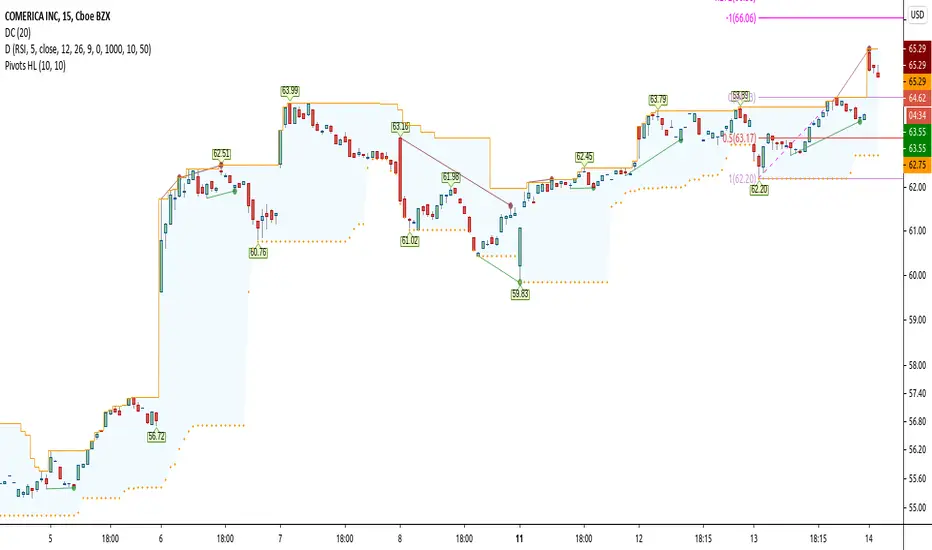
Cup and Handle Earnings Tomorrow BMOThe handle is in a rectangle. Financials have been hot but who knows when the sector will rotate out? The top line of the rectangle should be red as it is resistance.
Support at handle low 65.66 and Mid cup 48.85 Depth is 49.15 LONG ENTRY is 73.55
No recommendation

Breakout CorrectedWe have corrected the breakout today. As long as we are holding above yesterday's high we may likely rise again.
$CMA UPI LIKE HTIS FOR A SHORT TERM HOLD, SELL SOMETIME THIS WEEK. IT BROKE 10 EMA WHICH IS GOOD TODAY.
CMA at Double Pivot Resistance Area. Short PotentialCMA at a double resistance area. Volume and price volatility has died down. Look for price decrease.

$CMA - In a Range Expansion Mode#CMA: It's in a range expansion mode, after breaking out from Range-1 it's moving towards Range-2 breakout. But we may see a reaction at the Range-2 breakout zone before the breakout. Let's see.

COMERICA Publication DailyHey guys, COMERICA is in a fake bearish push with a low volume of executed sales and sellers refusal. The TIMEFRAME M1 shows a new sell-off of sellers with a large volume bear under the VWAP, which makes us say a trend change. That this one asks to go up, it goes in the direction of its next lower. Big possibility of breaking the VWAP Recover losses before session, then go to the next upper terminal (See TIMEFRAME H4). And if the buyers are really back arriving on the top after then finish on the DAILY and test the resistance of the end of the wick to reach the fence.
Please LIKE & FOLLOW, thank you!


CMA waiting for retestI think / hope there will be retest, use weekly 5ma and 10ma as place to watch.


CMA is approaching resistnace, potential drop! CMA is approaching our first resistance at 88.30 (Horizontal pullback resistance, 61.8% Fiboancci extension, 61.8% Fibonacci retracement) where a strong drop might occur below this level pushing price down to our major support at 76.33 (50% fibonacci retracement, 61.8 %Fibonacci extension).
Stochastic (89,5,3) is also approaching resistance where we might see a corresponding drop in price.

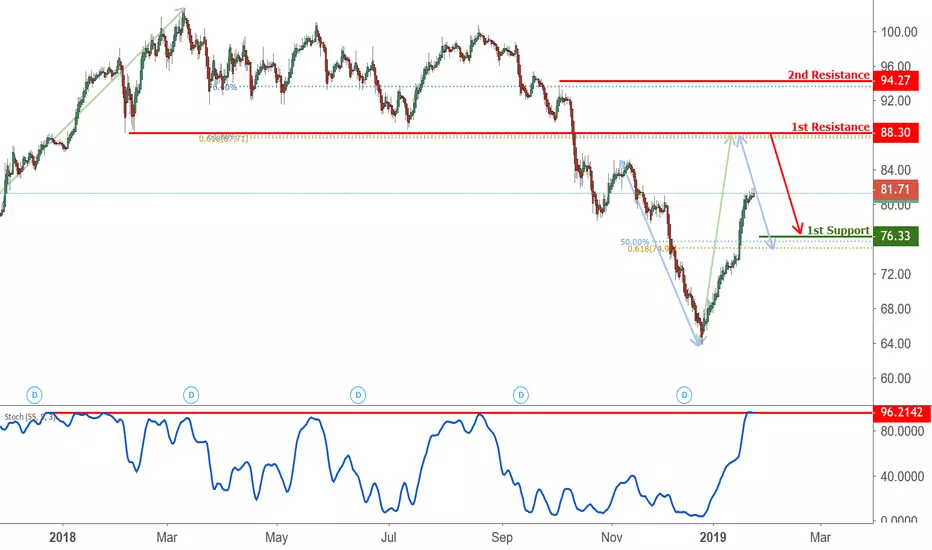
CMA Approaching resistance, potential drop! CMA is approaching our first resistance at 88.30 (horizontal pullback resistance, 50% Fibonacci retracement, 61.8% Fibonacci extension) where a strong drop might occur below this level pushing price down to our major support at 76.33 (50% Fibonacci retracement, 61.8% Fibonacci extension).
Stochastic (55,5,3) is also approaching resistance where we might see a corresponding drop in price.
CMA approaching resistance, potential drop! CMA is approaching our first resistance at 88.25 (horizontal pullback resistance, 61.8% Fibonacci extension, 61.8% Fibonacci retracement) where a strong drop might occur below this level pushing price down to our major support at 76.02 (horizontal swing low support 50% Fibonacci retracement).
RSI (55) is also approaching resistance where we might be seeing a drop below this level.


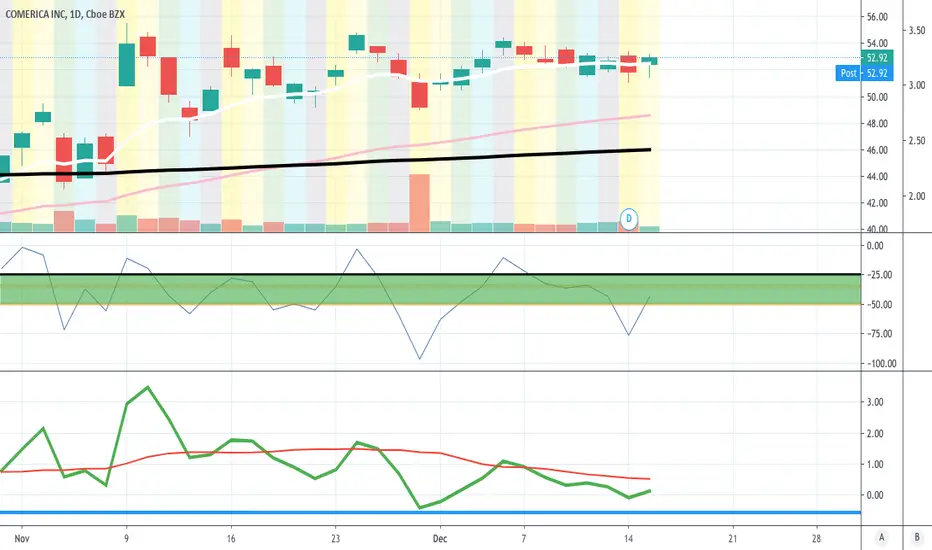
CMA another Double BottomComerica is another stock picked up by the SW because of a double pattern. The last candle comes after a gap and after a pullback on suport: this may be a good candidate for a long strategy to open on monday.