Volume will be all selling on SPYVolume has been so low as traders look for a new all time high, but big money is about to pull the plug. Going into the weekend ted as a baboon's butt.
SPY trade ideas

SPY evening star setupFor those of you who understand candlestick patterns, this is not news to you.
The weekly SPY is setting up an evening star formation. It's a bearish setup on a weekly chart. More importantly, it should be noted as a false breakout (if we close near current levels)

SPY - S&P 500 ETF Prediction May 31st 2024🔴 Resistance - 524 🔴
🚀 Target - 525 - 526 🚀
🟢 Support - 523 🟢
🚀 Target - 522 - 521 🚀
🚫 Manage Your Risk & Reward As Per Your Risk Management 🚫
🔥🔥 Levels Works Best on 5 - 15 Minutes Time Frame 🔥🔥
❤️❤️ MARKET SECRET ❤️❤️👇
1. TRADE WHAT YOU SEE NOT WHAT YOU ASSUME
2. FOLLOW THE TREND BECAUSE TREND IS YOUR ONLY FRIEND
3. CHART IS SUPREME
4. YOUR ASSUMPTION & EMOTIONS HAS NO VALUE IN THE MARKET
Our motto is to help each and every individual to reach and achieve their financial goals across the world by empowering individuals with the accurate knowledge and skills necessary to navigate the complexities of the financial markets successfully. 💪
Please NOTE 👉 Levels shared are for intraday trading only.
🚫 Disclaimer 🚫 All information shared here is for educational purposes only, Please consult your financial advisor for your financial matters before investing And taking any decision. We are not responsible for any profit/loss you make. No Buy Sell Recommended 🚫
Request your support and engagement by like, comment & follow to provide encouragement
CHEERS 👍

SPY Red Alert below 524.61 we need to look downWe have a Demark 13 weekly exhaustion count, 5th wave 1.0 extension on EW, negative divergence on the weekly MACD and failed breakout, if we don't close above 524.61 for the week then the market looks in trouble

SPY - S&P 500 ETF Prediction May 30th 2024🔴 Resistance - 524 🔴
🚀 Target - 525 - 526 🚀
🟢 Support - 523 🟢
🚀 Target - 522 - 521 🚀
🚫 Manage Your Risk & Reward As Per Your Risk Management 🚫
🔥🔥 Levels Works Best on 5 - 15 Minutes Time Frame 🔥🔥
❤️❤️ MARKET SECRET ❤️❤️👇
1. TRADE WHAT YOU SEE NOT WHAT YOU ASSUME
2. FOLLOW THE TREND BECAUSE TREND IS YOUR ONLY FRIEND
3. CHART IS SUPREME
4. YOUR ASSUMPTION & EMOTIONS HAS NO VALUE IN THE MARKET
Our motto is to help each and every individual to reach and achieve their financial goals across the world by empowering individuals with the accurate knowledge and skills necessary to navigate the complexities of the financial markets successfully. 💪
Please NOTE 👉 Levels shared are for intraday trading only.
🚫 Disclaimer 🚫 All information shared here is for educational purposes only, Please consult your financial advisor for your financial matters before investing And taking any decision. We are not responsible for any profit/loss you make. No Buy Sell Recommended 🚫
Request your support and engagement by like, comment & follow to provide encouragement
CHEERS 👍

SPY Short 3-8% Correction I Don't Think So Goo Long Bull RunThe correction??? In my opinion and chart theory suggest its time to go long and find the proper to stocks to be in
Subscribe for update stock pick and the best sectors to be in so your not left behind!!
as for todays daily chart set up I suggest calls at least a week out as chart indicates
Goodluck traders like and subscribe
as for members that listened
and got in Baba ,3m, Pltr, & Tesla congratulations
I woke up this morning up 10k took profit!! not that many industries where u make 10k over the weekend

$SPY - It can get ugly unless...If AMEX:SPY fails to bounce from here and breaks below $522 - $520 area, things will get ugly real quick!
The members of the Fed are becoming sports commentators, narrating every move in the macro data and causing havoc in the market.
Potential downside targets:
$515
$498
$475

$SPY May 31, 2024AMEX:SPY May 31, 2024
60 Minutes.
As expected, 522 was achieved.
21 ema of daily done.
In Both daily and 60 minutes the bar making ATH is the issue. It had close near low of bar.
Hence long for higher target is only above 533.5 levels with close near top of bar.
Yesterday i had shared A, B And C.
And said B and C was important for the day.
Today i will consider A the rise from 499.55 to 533.
We can see in daily the rise was swift.
Thats being corrected now.
I expect AMEX:SPY to consolidate around 516 - 517 levels before next uptrend as long as 488-492 is held on any retrace.
Now for the day in 15 minutes we have oscillator divergence.
AMEX:SPY making LL but not supported by Oscillator.
Considering the fall 529.9 to 521.34 a retrace to 526.5 is possible being 61.8% retracement and 10 averages too.
So today contra trade could be a buy around 522 - 522.5 levels for 525 - 526 as target or sell 525-526 for 518-519 levels.
$SPY update 5%+ correction then retest of highsOriginally I was thinking that we'd see a move to the $480 support after testing the highs, however, because we haven't fallen yet, the chart no longer supports that view.
Instead, I think the most likely scenario is that we fall on or after Wednesday 5/29 back to the low $500 area, then we go back to test the highs at $530.
The retest of $530, will setup the lower high which will start the bear market.
So basically there's one more chance to buy the dip in the low $500s, ride that back to the highs, and then you'll want to be a seller from July onwards.
Let's see how it plays out.

The market is taking a breakLooks like the market is going to make another visit to the uptrend line from October 2023. Be ready for a bumpy ride in the next couple of weeks. Save some cash for the right moment to buy or short something. We are still on a bull market.

SPY bigger pictureI am going slowly short.
SPY should make another leg down this week.
Level of interest is 475-470
Lets see what Wednesday will bring, until then we should stay flat.
From the lows of 470, we shall do the usual election run.
target 548?
Ill be updating this idea.


S&P stalls in indecision; still bullishLast week was marked with indecision. Market was moving in a narrow range while Buyers were waiting for FOMC ad NVDIA’s earnings. After receiving positive confirmation (FOMC neutral, earnings good) market tried to go higher but found no support from large players. Sellers took advantage of the weakness and dropped price, clearing many weak longs established in the previous 5 days. It was a strong move but for some reason sellers lacked conviction to go lower. Price pivoted after filling the gap from Wednesday 15th and went back into the balance zone ( 527.5-531.5 ).
We should expect more pushes and pulls in the short term while market is fishing for new information. To confirm their control buyers must clear last week high ( 533 ) and build value above it. Bears’ objective is to break last week low ( 525 ). Until it happens the most likely scenario is bracketing within last week range.
It is important to note that while short term direction is unclear, we are still in weekly uptrend. So bears must work twice hard to prove their strength
Disclaimer
I don't give trading or investing advice, just sharing my thoughts.

$SPY range $479-$529, the path to the top (and bear market)AMEX:SPY looks to be showing signs of weakness here. Thinking that we could see the first large decline of the year into one of the support levels below $479-$495. Breaking the trend line would be the trigger.
If that happens and we do get a low, then I think we'll have one final rally to the upper resistance levels between $525-$530.
Another possibility, is we just continue upwards to the top resistance levels and then decline after. Idea of a range is you want to buy the lows (supports on chart) and sell the highs (resistances chart).
Regardless of the path we take, we're nearing a top in the market and after we hit those top levels, I expect a large decline lower (one that takes us past the prior 2022 lows).
Ultimately looking for SPY to reach the $280-300 level by the end of 2024. But let's save that analysis after we see what happens in this range.

SPY turns bearish After pulling away from the upper Bollinger band earlier this week, the MACD has indicated that this Bullshit are about to be taken to the woodshed. Selling calls is easy money IMHO.

SPY levels - Time to be patient Let's quickly review some levels in SPY.
I can see potential support at 525 as a base flip level.
523 also looks like support - here are 21 EMA + the flag bottom + gap fill.
The obvious resistance here is 532-533.
One key thing I want to mention: the market is now ranging, and it's important to be patient and give it some time to form clearer price action and confirm the next momentum.

$SPYstill seein rather heavy accumulation here at gapfill. we sold our 530 PUTS for now. az long az CRAPPLE stayz over 190 this markets goin nowhere

$SPY Triple Top...AMEX:SPY getting spicy here, looks like a triple top for now headed into a lot of world news, ie Iran/Israel/Biden ... I think we've been overdue for a correction, this is a VERY solid base to start a downtrend and fill some gaps before heading back up for Trump Presidency... Buy the rumor stuff...
No positions, will look for continuation tomorrow...
- Prof
SPY might repeat itself??If spy repeat itself, it will be good buy. I still think we will see all time high end of the year

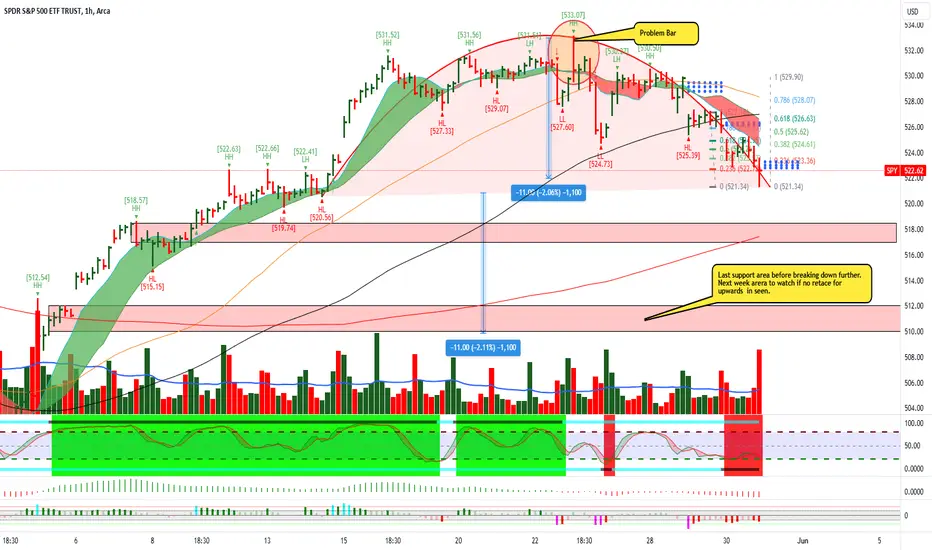
$SPY May 30,2024AMEX:SPY May 30,2024
15 Minutes.
At the moment long only above 533.07 for any higher targets.
A The rise from 493 to 533
B The rise from 519.74 to 533.07
C the fall from 529.9 to 525.39
AT the moment these are the 3 important numbers.
At the moment I will consider B and C only.
For the rise B important to hold 524 levels being 61.8% retracement for the rise.
For the fall 529.9 to 525.39, a retracement to 528 levels will give an opportunity to short.
At the moment upside is limited to 532 533 levels
Since we have multiple touch points on 531-533 levels, I expect a swift move upside once 533.5 is crossed convincingly.
And on downside 524 is important to hold. If 524 is broken, then we can see at least 521-522 as target which is 21 ema in daily.
So, I will think only on short side today.

SPY short hunt is ontoday is still early and will say next week for real signal but will put on a few puts today

ICT Short setup SPY swing trade, retracement trade👋Hello Traders,
Our 🖥️ AI system detected that there is an H4 or higher timeframe ICT Short setup in SPY for Swing trade.
Of course SPY is in up trend in Daily chart, so this is a retracement trade for reference.
Or you could consider to buy SPY after reaching the demand zone marked on chart.
Please refer to the details Stop loss, FVG(Sell Zone),open for take profit.
For more ideas, you are welcome to visit our profile in tradingview.
Have a good day!
Please give this post a like if you like this kind of simple idea, your feedback will bring our signal to next better level, thanks for support!

S&P500 ETF Trust (SPY) Fell 0.55% Today is the Bullish Run Over?Economic indicators are crucial for policymakers, advisors, investors, and businesses to make informed decisions regarding business strategies and financial markets. In the week ending May 23, the SPDR S&P 500 ETF Trust (SPY) fell 0.52%, while the Invesco S&P 500 Equal Weight ETF (RSP) was down 1.75%. This article examines three indicators from last week — existing home sales, new home sales, and consumer sentiment. These data points provide an update on the current state of the housing market and consumer attitudes about the current and future strength of the economy.
Existing home sales fell for a second straight month in April as elevated mortgage rates and increased home prices continue to weaken demand. The median price for an existing home sold last month was $407,600, an all-time high for the month of April, marking the 10th consecutive month of year-over-year increases for existing homes. New home sales fell 4.7% in April to a seasonally adjusted annual rate of 634,000 units, falling short of the expected 677,000 units. April’s sales are 7.7% below what they were a year ago, marking the first annual decline in over a year.
Consumer sentiment fell to its lowest level in six months, according to this month’s final report for the Michigan Consumer Sentiment Index. The Michigan Consumer Sentiment Index is a monthly survey measuring consumers’ opinions with regard to the economy, personal finances, business conditions, and buying conditions. A closer look at May’s report revealed that consumers are concerned over the labor market, high interest rates, income growth, and inflation.
The outlook for the stock market's most important driver just keeps getting better. S&P 500 earnings grew 6% in the first quarter from a year ago, according to data from FactSet. When excluding dismal earnings from Bristol Myers-Squibb (BMY), the results were even better, with earnings growing 10%, per Bank of America. Consensus now sees earnings growing 11.4% in 2024, up from a projection of 10.9% on April 5. In 2025, earnings growth estimates have moved up to 14.2% in 2025 from the 11.6% growth seen that day.
On Tuesday, UBS Investment Bank US equity strategist Jonathan Golub boosted his year-end S&P 500 target to 5,600 from 5,400, citing "stronger earnings." This trend is supported by further market upside, as economic "tail risks" have declined, with consensus estimates for economic growth increasing throughout the year. Deutsche Bank's chief global strategist Binky Chadha recently told Yahoo Finance that further growth than expected in the economy could help the S&P 500 reach 6,000 by the end of the year.
Technically, the S&P500 ETF Trust index price charts depicts the ending of the 5th wave Bullish Divergence pattern which resonates with Elliot Waves theory. The Relative Strength Index which sits at 58.60 signifies weaker growth from the consumer Index.
