SPY bigger pictureI am going slowly short.
SPY should make another leg down this week.
Level of interest is 475-470
Lets see what Wednesday will bring, until then we should stay flat.
From the lows of 470, we shall do the usual election run.
target 548?
Ill be updating this idea.
SPY trade ideas

SPY might repeat itself??If spy repeat itself, it will be good buy. I still think we will see all time high end of the year

$SPY May 30,2024AMEX:SPY May 30,2024
15 Minutes.
At the moment long only above 533.07 for any higher targets.
A The rise from 493 to 533
B The rise from 519.74 to 533.07
C the fall from 529.9 to 525.39
AT the moment these are the 3 important numbers.
At the moment I will consider B and C only.
For the rise B important to hold 524 levels being 61.8% retracement for the rise.
For the fall 529.9 to 525.39, a retracement to 528 levels will give an opportunity to short.
At the moment upside is limited to 532 533 levels
Since we have multiple touch points on 531-533 levels, I expect a swift move upside once 533.5 is crossed convincingly.
And on downside 524 is important to hold. If 524 is broken, then we can see at least 521-522 as target which is 21 ema in daily.
So, I will think only on short side today.

S&P stalls in indecision; still bullishLast week was marked with indecision. Market was moving in a narrow range while Buyers were waiting for FOMC ad NVDIA’s earnings. After receiving positive confirmation (FOMC neutral, earnings good) market tried to go higher but found no support from large players. Sellers took advantage of the weakness and dropped price, clearing many weak longs established in the previous 5 days. It was a strong move but for some reason sellers lacked conviction to go lower. Price pivoted after filling the gap from Wednesday 15th and went back into the balance zone ( 527.5-531.5 ).
We should expect more pushes and pulls in the short term while market is fishing for new information. To confirm their control buyers must clear last week high ( 533 ) and build value above it. Bears’ objective is to break last week low ( 525 ). Until it happens the most likely scenario is bracketing within last week range.
It is important to note that while short term direction is unclear, we are still in weekly uptrend. So bears must work twice hard to prove their strength
Disclaimer
I don't give trading or investing advice, just sharing my thoughts.

SPY short hunt is ontoday is still early and will say next week for real signal but will put on a few puts today

ICT Short setup SPY swing trade, retracement trade👋Hello Traders,
Our 🖥️ AI system detected that there is an H4 or higher timeframe ICT Short setup in SPY for Swing trade.
Of course SPY is in up trend in Daily chart, so this is a retracement trade for reference.
Or you could consider to buy SPY after reaching the demand zone marked on chart.
Please refer to the details Stop loss, FVG(Sell Zone),open for take profit.
For more ideas, you are welcome to visit our profile in tradingview.
Have a good day!
Please give this post a like if you like this kind of simple idea, your feedback will bring our signal to next better level, thanks for support!

$SPY range $479-$529, the path to the top (and bear market)AMEX:SPY looks to be showing signs of weakness here. Thinking that we could see the first large decline of the year into one of the support levels below $479-$495. Breaking the trend line would be the trigger.
If that happens and we do get a low, then I think we'll have one final rally to the upper resistance levels between $525-$530.
Another possibility, is we just continue upwards to the top resistance levels and then decline after. Idea of a range is you want to buy the lows (supports on chart) and sell the highs (resistances chart).
Regardless of the path we take, we're nearing a top in the market and after we hit those top levels, I expect a large decline lower (one that takes us past the prior 2022 lows).
Ultimately looking for SPY to reach the $280-300 level by the end of 2024. But let's save that analysis after we see what happens in this range.

S&P500 ETF Trust (SPY) Fell 0.55% Today is the Bullish Run Over?Economic indicators are crucial for policymakers, advisors, investors, and businesses to make informed decisions regarding business strategies and financial markets. In the week ending May 23, the SPDR S&P 500 ETF Trust (SPY) fell 0.52%, while the Invesco S&P 500 Equal Weight ETF (RSP) was down 1.75%. This article examines three indicators from last week — existing home sales, new home sales, and consumer sentiment. These data points provide an update on the current state of the housing market and consumer attitudes about the current and future strength of the economy.
Existing home sales fell for a second straight month in April as elevated mortgage rates and increased home prices continue to weaken demand. The median price for an existing home sold last month was $407,600, an all-time high for the month of April, marking the 10th consecutive month of year-over-year increases for existing homes. New home sales fell 4.7% in April to a seasonally adjusted annual rate of 634,000 units, falling short of the expected 677,000 units. April’s sales are 7.7% below what they were a year ago, marking the first annual decline in over a year.
Consumer sentiment fell to its lowest level in six months, according to this month’s final report for the Michigan Consumer Sentiment Index. The Michigan Consumer Sentiment Index is a monthly survey measuring consumers’ opinions with regard to the economy, personal finances, business conditions, and buying conditions. A closer look at May’s report revealed that consumers are concerned over the labor market, high interest rates, income growth, and inflation.
The outlook for the stock market's most important driver just keeps getting better. S&P 500 earnings grew 6% in the first quarter from a year ago, according to data from FactSet. When excluding dismal earnings from Bristol Myers-Squibb (BMY), the results were even better, with earnings growing 10%, per Bank of America. Consensus now sees earnings growing 11.4% in 2024, up from a projection of 10.9% on April 5. In 2025, earnings growth estimates have moved up to 14.2% in 2025 from the 11.6% growth seen that day.
On Tuesday, UBS Investment Bank US equity strategist Jonathan Golub boosted his year-end S&P 500 target to 5,600 from 5,400, citing "stronger earnings." This trend is supported by further market upside, as economic "tail risks" have declined, with consensus estimates for economic growth increasing throughout the year. Deutsche Bank's chief global strategist Binky Chadha recently told Yahoo Finance that further growth than expected in the economy could help the S&P 500 reach 6,000 by the end of the year.
Technically, the S&P500 ETF Trust index price charts depicts the ending of the 5th wave Bullish Divergence pattern which resonates with Elliot Waves theory. The Relative Strength Index which sits at 58.60 signifies weaker growth from the consumer Index.

SPY Short 3-8% Correction I Don't Think So Goo Long Bull RunThe correction??? In my opinion and chart theory suggest its time to go long and find the proper to stocks to be in
Subscribe for update stock pick and the best sectors to be in so your not left behind!!
as for todays daily chart set up I suggest calls at least a week out as chart indicates
Goodluck traders like and subscribe
as for members that listened
and got in Baba ,3m, Pltr, & Tesla congratulations
I woke up this morning up 10k took profit!! not that many industries where u make 10k over the weekend

back to ATHs very possibleAMEX:SPY had an interesting wick
In my opinion all it did was rebalance, and took some stops i honetsly see it opening limit up on tuesday

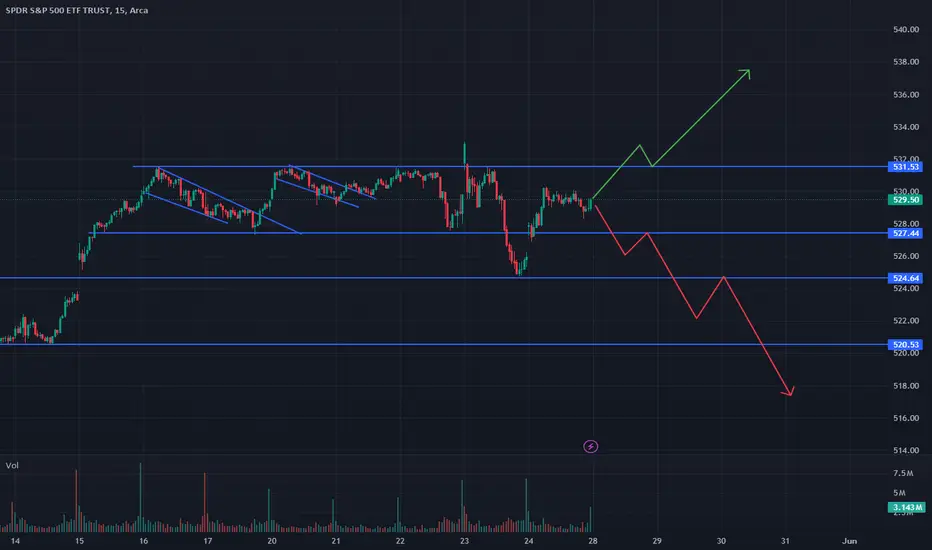
SPY levels - Time to be patient Let's quickly review some levels in SPY.
I can see potential support at 525 as a base flip level.
523 also looks like support - here are 21 EMA + the flag bottom + gap fill.
The obvious resistance here is 532-533.
One key thing I want to mention: the market is now ranging, and it's important to be patient and give it some time to form clearer price action and confirm the next momentum.

$SPY & CRE PanicIgnoring mainstream news and whatever and only using my data i'm seeing that CRE is experiencing unknown trouble. While SPY and other indices have been pumping possibly thanks to NVDA, CRE has been experiencing big trouble.
I think CRE trouble may spill over to the rest of the market as some kind of SVB/SIVB-like event sometime soon e.g June/July and will end at the start-mid August.
In my data below there's a big gap between SPY & CRE. When this gap first started forming, SPY did follow CRE data downwards but then got saved by... i dunno NVDA, the rest of the market... no idea. imgur.com
Point is the gap still exists and gaps are always fulfilled by being closed off one way or another.
"In a deep pub Clive British voice": I recon SPY goes down soon.
There's a chance we triple top on SPY before anything actually happens e.g we visit $523, then back up to $535, then after some consolidation finally break downwards to the $465's area. Actually hoping we this current double top resolves starting now and we do a quick visit to $465 before rebounding back upwards.
Thanks for attending this Ted talk.

Ichimoku Watch: SPDR S&P 500 ETF Trust Engaging with SupportDesigned to track the performance of the S&P 500 market index, the SPDR S&P 500 ETF Trust (current AUM is US$529,081.40 million) is engaging with an interesting area of support on the 4h chart after gapping lower on Wednesday. This follows an all-time high forged last week at $534.00.
SPDR Testing Support
The uptrend in this market at the moment is obvious, and traders, therefore, will be seeking locations for dip-buying opportunities.
The Ichimoku Cloud’s upper limit was tested yesterday, currently between $525 and $529 (the difference between the Leading Span A and Leading Span B), and could be enough to encourage buying. This is also the first time the Cloud has been tested since the Leading Span A crossed above the Leading Span B at the beginning of May.
Within the Cloud, there is also a 100% projection ratio at $522.00, which, for many harmonic traders, will be recognised as a potential AB=CD support level. Further to this, a trendline support (from the low of $493.86) is close to this level.
Adding to the above analysis, the Conversion Line appears poised to cross back above the Base Line, which, given the uptrend, would be observed as a bullish signal.
Price Direction Favouring Bulls
The trend in this market and the current support structure suggest that it remains a buyers’ market. Within the Ichimoku Cloud, the AB=CD support and trendline support could provide a floor to which dip-buyers may be drawn.
However, should the Conversion Line cross back above the Base Line prior to testing the above support area, we could see dip-buyers enter this market earlier to challenge all-time highs.

$SPY May 29, 2024AMEX:SPY May 29, 2024
15 Minutes
The steep fall from 533.07 to 524.73 is getting sorted out. Sideways consolidation.
For the risefrom 524.73 to 530.5 AMEX:SPY has retraced nearly 61.8%.
Consider the last rise from 527.11 to 529.8 holding 528 levels i have a target 530 - 532 levels and on downside if 527 is broken possible target is 524-525 levels.
So being 2$ on both sides i prefer to sit out today also.

This is my personal planDrew a line for where I'm looking SPY to open tomorrow, hoping buyers swoop in and try for ATH, should be easy since all the big names are down but without catalyst for correction. Either way, looking towards second week of June if the medium time frame MA is to be followed.
Just hard to believe that Friday's inflation data will be positive -- but I'm thinking while inflation holds steady, household income will fall, and we'll see how markets react to that.
Otherwise, chop chop

SPY - S&P 500 ETF Prediction May 27th 2024🔴 Resistance - 529 🔴
🚀 Target - 530 - 531 🚀
🟢 Support - 529 🟢
🚀 Target - 528 - 527 🚀
🚫 Manage Your Risk & Reward As Per Your Risk Management 🚫
🔥🔥 Levels Works Best on 5 - 15 Minutes Time Frame 🔥🔥
❤️❤️ MARKET SECRET ❤️❤️👇
1. TRADE WHAT YOU SEE NOT WHAT YOU ASSUME
2. FOLLOW THE TREND BECAUSE TREND IS YOUR ONLY FRIEND
3. CHART IS SUPREME
4. YOUR ASSUMPTION & EMOTIONS HAS NO VALUE IN THE MARKET
Our motto is to help each and every individual to reach and achieve their financial goals across the world by empowering individuals with the accurate knowledge and skills necessary to navigate the complexities of the financial markets successfully. 💪
Please NOTE 👉 Levels shared are for intraday trading only.
🚫 Disclaimer 🚫 All information shared here is for educational purposes only, Please consult your financial advisor for your financial matters before investing And taking any decision. We are not responsible for any profit/loss you make. No Buy Sell Recommended 🚫
Request your support and engagement by like, comment & follow to provide encouragement
CHEERS 👍

$SPY update 5%+ correction then retest of highsOriginally I was thinking that we'd see a move to the $480 support after testing the highs, however, because we haven't fallen yet, the chart no longer supports that view.
Instead, I think the most likely scenario is that we fall on or after Wednesday 5/29 back to the low $500 area, then we go back to test the highs at $530.
The retest of $530, will setup the lower high which will start the bear market.
So basically there's one more chance to buy the dip in the low $500s, ride that back to the highs, and then you'll want to be a seller from July onwards.
Let's see how it plays out.

Market(s) move the world around Events occur around the chart(s) and never vice versa.
Its aways all about WHEN to move the market

SPY Will Go UP! Buy!
Hello,Traders!
SPY is trading in an
Uptrend and the ETF
Is now making a bullish
Rebound from the
Horizontal support level
Of 524$ so we are
Bullish biased and we
Will be expecting
A further bullish continuation
Buy!
Like, comment and subscribe to help us grow!
Check out other forecasts below too!

SPY Trade Ideas for the Week of 5/27/2024I'm leaning bullish, but there will be equal opportunity on either side unless we chop all week.

Ninja Talks EP 36: CockamamieDefinition;
"Ridiculous, implausible or nonsensical."
Just some of the words that come to mind when I see bambi traders who are still wet behind the ears "jeet" into meme coins with their $500 in life savings clutched in their fist hoping to hit it big in the memesino.
Sad.
Instead of spending time formulating foundational trading principles and a strong thesis on direction, they idolize doge coin millionaires as if they 're the second coming of Christ.
Turning water into rancid dog shi...can I swear on here?
In any event, my reason for writing this psychological thriller of a post is two fold;
1) We are not even at peak hysteria yet and dumb money is already flowing to these lottery ticket tickers.
It's almost time to make the biggest pychological shift in your trading you will ever make so be prepared, because while everyone else is selling their sound investments and converting it to cat tokens YOU have the opportunity to observe the FOMO within yourself.
Once you conquer this and hold the line, you are unstoppable.
2) Spending this time creating strong first principles , the techniques will come (they always do), but success comes slowly and consistently with a principle-based trading diet.
Try not to fill up on an over-processed all you can eat meme coin buffets, because when the time comes and you need empty space for your investment you will be too bloated to eat.
Be wise my friend.
"Knowing yourself is the beginning of all wisdom." - Aristotle
Rant over.

$SPY May 27, 2024AMEX:SPY May 27, 2024
15 Minutes
For the day my range is fixed between 532 - 524.
All moving averages have converged in 15 minutes.
For the sharp fall from 533.07 to 524.73 AMEX:SPY resisted around 618% retracement being 530 levels.
If a consider the rise 524.73 to 530.27, holding 526.5 today i have a target 530 - 532.
If AMEX:SPY closed below 526.5 in 15 minutes bar with close near low of bar i expect 523- 524 to be resisted first.
No trade day for me today.
