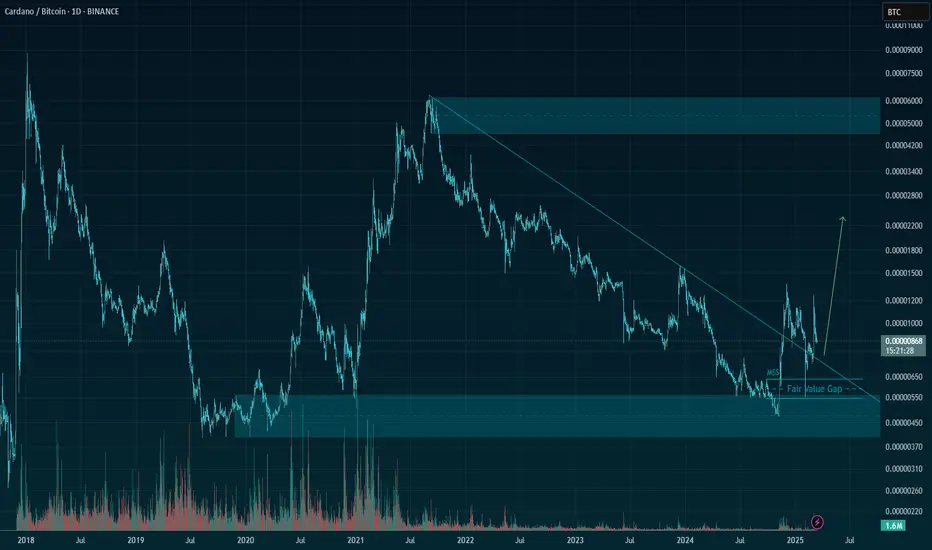
Cardano: The Longest Downtrend Ever Ends, Marketwide Bullish...The downtrend for Cardano vs Bitcoin (ADABTC) ended November 2024. If the uptrend last an entire year, 365 days, this would put a peak at around November 2025.
There is a dynamic where the end of the BTC pairs bullish trend happens before Bitcoin's peak price. That is because when you sell a BTC pa
Key data points
No news here
Looks like there's nothing to report right now

$ADA / $BTC – History Doesn’t Repeat? It can Rhymes The pair just bounced from a historically significant support zone that marked the beginning of the previous cycle’s rally. Once again, we’ve broken out of the long-term downtrend with a clean retest – just like in 2020.
The last cycle saw ADA/BTC shoot into the “Golden Pocket” after a similar stru

ADA/BTC Technical Analysis: Bullish MomentumThe ADA/BTC pair is currently navigating a critical point in its price action. With ADA's fundamental progress in the Cardano ecosystem and its strong focus on decentralized finance (DeFi), many traders are keeping a close eye on its performance against Bitcoin. Despite the recent volatility in the


Cardano (ADA) Rockets 1300% Gains at 10x Leverage!Trade Overview:
CARDANO (ADA) on the 4-hour timeframe showcased a phenomenal long trade setup using the Risological Green Lines and the Risological Swing Trader. The trade captured an impressive 1300% gain at 10x leverage, demonstrating the strength of the tools in identifying market momentum.
K

See all ideas
Summarizing what the indicators are suggesting.
Oscillators
Neutral
SellBuy
Strong sellStrong buy
Strong sellSellNeutralBuyStrong buy
Oscillators
Neutral
SellBuy
Strong sellStrong buy
Strong sellSellNeutralBuyStrong buy
Summary
Neutral
SellBuy
Strong sellStrong buy
Strong sellSellNeutralBuyStrong buy
Summary
Neutral
SellBuy
Strong sellStrong buy
Strong sellSellNeutralBuyStrong buy
Summary
Neutral
SellBuy
Strong sellStrong buy
Strong sellSellNeutralBuyStrong buy
Moving Averages
Neutral
SellBuy
Strong sellStrong buy
Strong sellSellNeutralBuyStrong buy
Moving Averages
Neutral
SellBuy
Strong sellStrong buy
Strong sellSellNeutralBuyStrong buy
Displays a symbol's price movements over previous years to identify recurring trends.