NLST - Shake out before moving up again?Netlist ran on a good court settlement and then sold off. We came back and retested support, so now I can see us moving up again to the targets above. Not financial advice, DYOR.

PBR Back from Earnings DumpBrazil's largest oil producer just announced another huge dividend of 0.339. Ex-div June 12, payment Sep 26. That's 18.76%!
Price action is reversing off support of 14.96 and HMA crossed over bullish. We've seen this before back in March from another earnings dump and it recovered nicely.

TSHA - long - catalyst playTaysha Gene Therapies Inc is a patient-centric gene therapy company to eradicate monogenic CNS disease. It is focused on developing and commercializing AAV-based gene therapies for the treatment of monogenic diseases of the CNS in both rare and large patient populations. The company develops and commercializes transformative gene therapy treatments. It is advancing a deep and sustainable product portfolio of 18 gene therapy product candidates, with exclusive options to acquire four additional development programs. Its product candidates include TSHA-101, TSHA-118, TSHA-102, TSHA-103, and TSHA-104
This is not a financial advice!
Upcoming catalyst on 31st. of March
We need to stay in a bullish overal sentiment of the market. If we see a corretion, this play might doesn't work.
13% short float
Rel. Vol. at 3.13
Block buys and Passive Stakes
Keep an eye on 2.0, 2.50, 3.0, 3.9 and 5.0 level, needs to get broken for a further upmove. You can take partial profits at these levels if u want to lock in gains.
SL under 1.10
TP approx. 5.0
Most info on the chart.
Trade carefully!

ENPH Weekly/Monthly Analysis!1)I applied 2 moving averages on prices which have 5 period(red one) 20 period(green one) have cut each other and we got buy sign this week because we had to wait at the end of this week's closing candlestick on prices.
2) Also i have drawn resistance lines on prices and they have been broken this week with green candlestick. This is another buy sign.
3) RSI indicator has broken its resistance line this week and it will increase soon in my opinion. Also its 2 moving averages which are purple and green have cut each other.
4) Momentum has broken its resistance line this week. Also i applied SMA(8 period) on Momentum indicator. Momentum cut above its moving average and it is another buy sign.
5) MACD lost its strong down trend power as you saw. As i showed you on indicator, red bars are going sideways not going down showed us maybe reversal trend can occur.

Trump Media could be this years GamestopI am not kidding!
Political motivated investing could moon this thing
forget P/e's cashflow
This is memecoin style investing on the stock market
Its happened before it could happen again
particularly as we get into the election in November and inauguration in January
#MAGA

TSLA Descending Triangle Chart Pattern and Monthly Analysis!1) I applied 2 moving averages which have 5 period(red one) and 20 period(green one). Red one cut below orange one it is sell sign.
2) Descending triangle occurred here and previous support line was broken. On the other hand, Pullback has happened but it could not reach above of this support line. Descending triangle is generally reversal pattern in technical analysis.

Glemark idea | Key levelsGlemark idea | Key levels ( Probabilities )
Glenmark to remain bullish above the trendline
Targets - 1233/1256/1303/1335/1414/1525
stop loss - 1116

We will wait to June or July for SEDG!!!1) I drew Resistance line on RSI Indicator.
2) I drew Resistance line on Momentum Indicator.
3) I drew Resistance line on CCI Indicator.
4) I drew Resistance line on MACD Indicator.

RMDA Opportunities Exposure to "RMDA" stock
On testing the resistance at the 2.20 level, it rose to approximately 5%, and there are opportunities for growth during approximately the week’s session on the 2.5 test.

AAP Good situation to buy!!! Not Investing Advice!!!1) I applied WMA(14 period) on CCI indicator and it gave us to buy sign before 2 months ago.
2) I applied SMA(8 period) on Momentum indicator but it have not cross yet. They are very close each other. It is close to break its resistance level.
3) RSI indicator is going approximately 25-30 level for monthly period. Also it broke its resistance line. 25-30 level is meaning that security has been sold a lot. It can be good opportunity to buy in this area but it is not working very good when security has strong trend. RSI's 2 moving average did not cross each other and it is sign to us for waiting.
4) MACD has light red bars as you see on the screen and please check out all arrows on the screen. In my opinion they will cross each other soon. Light red bars are giving this message to us Down Trend is decreasing and Upper Trend can show itself.
5) We have no any divergence on indicators.
6) DMI indicator has 3 moving average and Red one represents ADX. Orange one represents -DI. Blue one represent +DI. If Blue cuts above Orange line it is buy sign but they are away from each other. On the other hand if ADX cuts above -DI it is buy sign and they are going each other.
7) I applied DEMA on prices and their period Orange one is 5 period and Red one is 20 period. We have not got any buy sign from there.

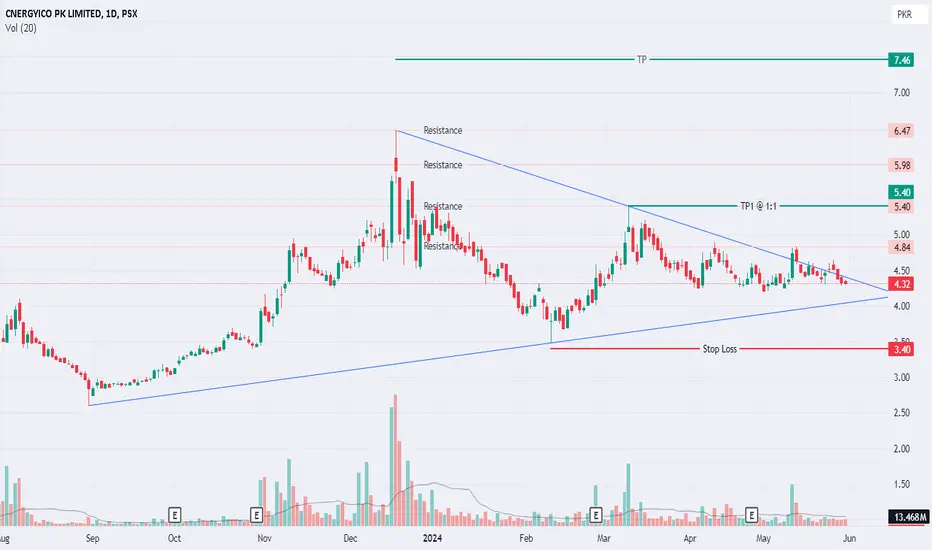
PSX: CNERGY foundation has been laid.From the start of this year the CNERGY has been struggling to sustain it journey to north and has not been successful in its attempts. In all this a triangle has been formed suggesting that it will resume its journey in whichever direction it breaks. Currently the price is breaching the upper trend line creating a bias for upward movement.
SL for the trade is 3.40 & correspondingly the TP is 5.40. Close above 5.40 shall lead to the medium term TP which is 7.48
Wishing you Profitable Trading
AMSC Computer medium cap beats earnings LONGAMSC on the daily chart has went 3X in 7-8 months on the strength of earnings beats and
the tailwinds of the AI supertrend. I see this as an excellent swing long trade to hold into
the next earnings in 3-4 months. AMSC is currently at its ATH and going higher means no
overhead resistance.

RDFN fintech small cap reverses higher LONGRDFN on the 15 minute chart has move up from a low pivot which included a mass index
indicator triggering. ATH was $85 so current price is 7-8% of that ATH. I will take a long trade
here. My targets are the May high pivot at $8 and the January high pivot at $10 with a stop
loss at $6 to be managed as the price moves toward 8. RDFN to a certain degree is subject to
rates and federal actions. I am convinced that when the time is ripe the Biden administration
will pressure the " independent" fed into a rate cut which should give RDFN the momentum it
needs to push toward those targets or even higher.

NIKE - Hawk'em Strat (jun week2) - buy Expect week of June first to hit currency on the negative side allowing stocks to rally up.
Strat shows a strategic (4.7%)/(5.5%) incline. nike's bullish statistical data suggests a short-term uptrend aligning with SEIIV Studio's statistical data which shows valid coordination in the fathering markets main objetive = 3.3% goal = Nike 5 day bull window
Reversal shows end of trade reversal goal. TP is forecasted as half of original reversal target of 5.7%
Webull Trading Plan :
week 2 of june
Strike price: $97
(buy order) limit price: 0.45
(TP) Limit Price: 0.97
stop Price 0.28
Contracts = 6

GamestopClear signs of GME Breaking out. This should pop one of these days up up up
These are my views and my views alone. This is educational only

BB Copium AnalysisSomething to think about.
At the end of the first 46 bar pattern end we went sideways for 5 months.
At the end of our current 46 bar pattern we are sideways for the last 5 months.
RSI at bottom for both patterns ending.
Posting this to be able to hit the little play button later and see how it panned out.
Thank you.
“There is no present or future-only the past, happening over and over again-now.”
- Eugene O'Neill

Important section: 1071.36-1130.53Hello, traders.
If you "Follow", you can always get new information quickly.
Please click "Boost" as well.
Have a nice day today.
-------------------------------------
(1M chart)
The key is whether the price can be maintained by rising above the Fibonacci ratio 3.618 (1135.97), which is the peak of the major uptrend.
If not, it is expected to form a downtrend and form a new trend.
(1W chart)
The Fibonacci ratio on the right is shown in the major uptrend.
The Fibonacci ratio on the left is shown in the recent uptrend on the 1W chart.
Accordingly, if the price is maintained above the right Fibonacci ratio 3.618 (1135.97), it is expected to rise to the left Fibonacci ratio 1 (1339.36).
The important section on the 1W chart is around 848.46.
Accordingly, if it fails to rise above 1130.53, it should check for support near 848.46.
The rising channel indicated by the circle is a trend line connected between lows.
Therefore, if it cannot rise within the current rising channel, the key is whether it rises along the rising channel between lows indicated by the circle.
(1D chart)
The HA-High indicator on the 1D chart is showing signs of being created at the 1071.36 point.
Accordingly, the important section on the 1D chart is around 1071.36.
Therefore, the section 1071.36-1130.53 is the important section.
This volatility period is around June 4th (June 3rd-5th).
Therefore, it is necessary to check in which direction it deviates from the section 1071.36-1130.53 after the volatility period.
Have a good time.
Thank you.
--------------------------------------------------
- Big picture
It is expected that a full-scale uptrend will start after it rises above 29K.
The section expected to touch in the next bull market is 81K-95K.
#BTCUSD 12M
1st: 44234.54
2nd: 61383.23
3rd: 89126.41
101875.70-106275.10 (overshooting)
4th: 13401.28
151166.97-157451.83 (overshooting)
5th: 178910.15
These are points where resistance is likely to occur in the future.
We need to check if these points can be broken upward.
We need to check the movement when this section is touched because I think a new trend can be created in the overshooting section.
#BTCUSD 1M
If the major uptrend continues until 2025, it is expected to start forming a pull back pattern after rising to around 57014.33.
1st: 43833.05
2nd: 32992.55
-----------------

Salesforce BullsSalesforce bulls have stepped in here.
Fibonacci Confluence at the 0.382 and the 0.5 Fibonacci Speedfan.
Bounce off a monthly horizontal support level. Bull stepped in and we were able to get a bullish hammer candle.
Bulls back to take control from here? I suspect sideways consolidation before a move back up towards the path of $400+

Utilities SurgeRead the chart for the lesson. This is very valuable and is not just used for the macro


Support zone: Around 189.84Hello, traders.
If you "Follow", you can always get new information quickly.
Please click "Boost" as well.
Have a nice day today.
-------------------------------------
(1M chart)
You need to check if it is rising along the rising channel.
The important zone on the 1M chart is around 175.45.
(1W chart)
The important zone on the 1W chart is around 189.42.
Therefore, the support zone is the 175.45-189.42 zone.
You need to check if it is forming a trend while passing through the week including July 22nd and the week including August 19th.
If it falls below 157.65, we need to check for support near 136.72.
(1D chart)
The important sections on the 1D chart are around 189.84 and 172.16.
Therefore, the key is whether it can find support near 189.84 and rise above the Fibonacci ratio of 0.5 (197.89).
If it falls near 189.84 and shows resistance,
1st: 181.99
2nd: 172.16-175.45
We need to check for support near the 1st and 2nd above.
Have a good time.
Thank you.
--------------------------------------------------
- Big picture
It is expected that the real uptrend will start after rising above 29K.
The section expected to be touched in the next bull market is 81K-95K.
#BTCUSD 12M
1st: 44234.54
2nd: 61383.23
3rd: 89126.41
101875.70-106275.10 (when overshooting)
4th: 13401.28
151166.97-157451.83 (when overshooting)
5th: 178910.15
These are points where resistance is likely to occur in the future.
We need to check if these points can be broken upward.
Since it is thought that a new trend can be created in the overshooting section, it is necessary to check the movement when this section is touched.
#BTCUSD 1M
If the major upward trend continues until 2025, it is expected to start by creating a pull back pattern after rising to around 57014.33.
1st: 43833.05
2nd: 32992.55
-----------------

Support zone: Around 67300-70700Hello, traders.
If you "Follow", you can always get new information quickly.
Please click "Boost" as well.
Have a nice day today.
-------------------------------------
(Samsung Electronics 1M chart)
The area around 70700 is likely to complete the 'M' pattern and turn into a downtrend.
Therefore, whether there is support around 70700 is an important issue.
(1W chart)
The important zones on the 1W chart are around 77500 and 57400.
Therefore, the key is whether the price can be maintained above 77500 when it rises with support near 70700 as mentioned on the 1M chart.
If not, and it falls near 70700, there is a possibility that it will fall to around 57400.
Since the 57400 point is the HA-Low indicator point on the 1D chart, there is a possibility that the HA-Low indicator will be newly created as the price falls.
Therefore, if the HA-Low indicator is newly created, whether there is support near that area will be an important issue.
(1D chart)
The important sections on the 1W chart are around 84300 and 67300.
Accordingly, we can see that the area around 67300-70700 is the support area.
If it is supported near the support zone and rises,
1st: 77500-79400
2nd: 84300
The 1st and 2nd zones above are short-term resistance zones.
However, if it is confirmed that it is supported in this resistance zone, there is a possibility that it will update the previous latest high.
The fact that the HA-Low indicator was created means that a high point zone has been formed.
Therefore, since the HA-Low indicator on the 1D chart was created at the 84300 point, it is a high point zone.
Therefore, in order for a full-scale uptrend to begin, the price must be maintained above the HA-High indicator.
If the HA-Low indicator is created, it means that a low point zone has been formed.
Have a good time.
Thank you.
--------------------------------------------------
- Big picture
It is expected that a full-scale uptrend will begin when it rises above 29K.
The next expected range to touch is 81K-95K.
#BTCUSD 12M
1st: 44234.54
2nd: 61383.23
3rd: 89126.41
101875.70-106275.10 (overshooting)
4th: 13401.28
151166.97-157451.83 (overshooting)
5th: 178910.15
These are points that are likely to receive resistance in the future.
We need to check if these points can be broken upward.
We need to check the movement when this range is touched because it is thought that a new trend can be created in the overshooting range.
#BTCUSD 1M
If the major uptrend continues until 2025, it is expected to start forming a pull back pattern after rising to around 57014.33.
1st: 43833.05
2nd: 32992.55
-----------------

Amzn inverse head and shouldersAmazon is printing a massive inverse head and shoulders on the daily chart. Daily is obviously more reliable than lower time frames. The upside projection of this lands right on a key fib level around 210$. I expect this to play out as AMZN is way more undervalued than the other Mag 7 stocks save googl. Amazon also has so many sectors and a massive monopoly style moat.
-210$ in the next quarter imo
