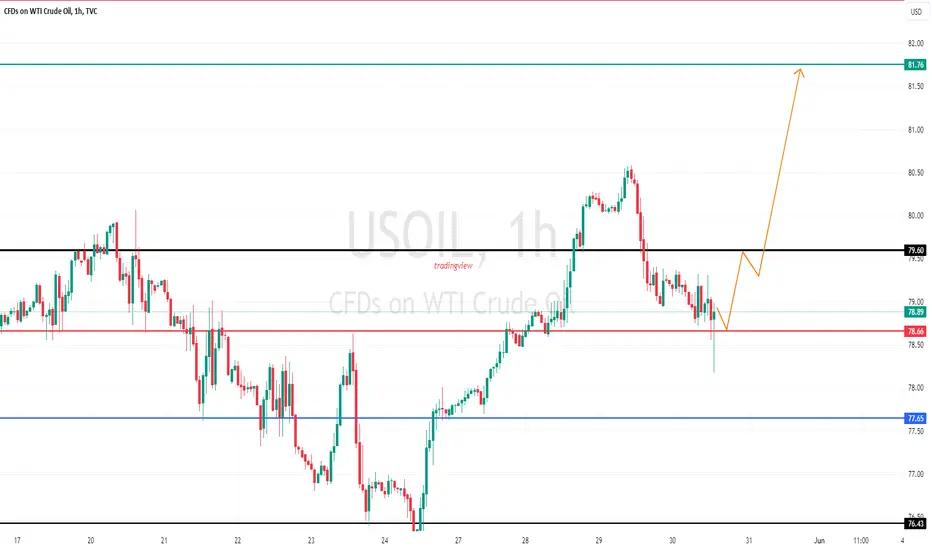
USOIL - where is current support? holding or not??#USDOIL.. market placed 80 plus day high and dropped again . now market have a supporting area here,
keep close it because if market hold it then again bounce expected from here,
don't be lazy here.
good luck
trade wisely
USDWTI trade ideas
USOIL BEARS WILL DOMINATE THE MARKET|SHORT
Hello,Friends!
We are targeting the 77.96 level area with our short trade on USOIL which is based on the fact that the pair is overbought on the BB band scale and is also approaching a resistance line above thus going us a good entry option.
✅LIKE AND COMMENT MY IDEAS✅

CRUDE OIL (WTI): Is That a Bull Trap?!
Crude Oil may drop after a potential bullish trap:
we see a bullish inducement and a violation of a key horizontal resistance,
followed by a strong bearish imbalance.
I think that the market may drop at least to 78.8 level.
❤️Please, support my work with like, thank you!❤️

USOIL - Short or Buy? Break down or retracement up?Technicals
1. We have been stuck in a range on a higher time frame for quite some time now.
2. On a higher time frame we failed to confirm a break-up from a trendline dating back to March 2022, which was the COVID-19 highs. A failed break-up of this mega trendline is normally a sign of big reversal or retracement. & we did just that ;-) question is, is this a reversal or just a retracement because I see also a trendline from DEC 2023 which we trade just under. IMO we have not fully confirmed that break down.
3. Visible in my chart we see that we are since then on a big down sloping channel which is still respected.
Fundamentals
1. My bias is slightly bearish long term because I think the US economy & other major economies will be in a recession which will give downside pressure on the price of OIL
2. Conflict in the Middle East seems to have not a significant impact as of now on the price of USOIL. Will this change? Till I see major escalation happening I don't see that it will have greater impact than it already has. US also is less energy dependent so therefor geopolitical will impact less.
3. Bullish sign is that OPEC is still holding strong on OIL cuts and China is still strong. Summer season will also give some upside pressure because of demand.
Trade
1. The first trade, which is a buy option, I will take if I see buyers really taking over to push price up
2. The second trade, which is a sell, I will take if we confirm a break and retest of the weekly low.
Great trading all of you
Greetingz,
Simba Trades


usoil is bearishInvestors are cautious about U.S. inflation and interest rates, pushing oil prices lower.
Fed officials indicate more signs of slowing inflation are needed for rate cuts.
Despite increased refinery capacity, demand remains weak, adding pressure on oil prices.
Given the persistent inflation concerns and the cautious stance of the Federal Reserve, the outlook for crude oil prices remains bearish in the short term. The combination of weak refinery demand, ample supply, and geopolitical uncertainties points to continued price pressure. However, OPEC+ production cuts could offer some support, preventing a steeper decline. Traders should monitor upcoming economic data and OPEC+ decisions closely for further market direction.

Oil Down TrendMy first analysis on US Oil.
We are in a clear downtrend on the monthly time frame and price continues to make lower lows on the lower tome frames (4HR - 1 W).
Short term pullbacks offer selling opportunities.
Keep in mind that over the following week we have the following news data:
June 3 - June 7:
Final Manufacturing PMI
ISM Manufacturing PMI
JOLTS Job Openings
ADP Non-Farm Employment Change
ISM Services PMI
Unemployment Claims
Average Hourly Earnings m/m
Non-Farm Employment Change
Unemployment Rate

WTI in daily chart Hello
I don't think it is necessary to repeat same expressions because it is really boring. What is happening in OIL market is to decrease the price and increase the sell power to balance it.
WTI was able to penetrate into our resistance level and it is making a first wave. We traders should change our decisions whenever it is necessary and never insist in our ideas. For now I am following the bearish market for Oil. I am not sure how long it can correct (may till Trump becomes US president) and we have to decide fir short-term because Oil (as I mentioned in my last ideas) is in a consolidation (range) are with many R/S level.
Thanks

USOIL Downtrend Line Rejection At $78.11 31.05.2024- USOIL downtrend line rejection at $78.11 on 30-minute chart
- If rejection holds, likely drop to $77.44
- Break below $77.44 could lead to $75.53
- If rejection fails, potential rise to $78.63
- Break above $78.63 could push price to $79.00
- Apply Risk Management
_____________________________________________________________________________
Risk Warning: Trading in CFDs is highly speculative and carries a high level of risk. It is possible to lose all of your invested capital. These products may not be suitable for everyone, and you should ensure that you fully understand the risks taking into consideration your investment objectives, level of experience, personal circumstances as well as personal resources. Speculate only with funds that you can afford to lose. Seek independent advice if necessary. Please refer to our Risk Disclosure.
BDSwiss is a trading name of BDS Markets and BDS Ltd.
BDS Markets is a company incorporated under the laws of the Republic of Mauritius and is authorized and regulated by the Financial Services Commission of Mauritius ( FSC ) under license number C116016172, address: 6th Floor, Tower 1, Nexteracom Building 72201 Ebene.
BDS Ltd is authorized and regulated by the Financial Services Authority Seychelles (FSA) under license number SD047, address: Suite 3, Global Village, Jivan’s Complex, Mont Fleuri, Mahe, Seychelles. Payment transactions are managed by BDS Markets (Registration number: 143350)

Should we wait for lower oil prices?
In the analysis of the oil chart, the main trend line of the upward movement (blue line) has been broken, and the broken candle is marked with an arrow. It seems that we have to wait for lower prices for oil.
Do you agree with my opinion?

USOIL BEST PLACE TO BUY FROM|LONG
Hello,Friends!
Bullish trend on USOIL, defined by the green colour of the last week candle combined with the fact the pair is oversold based on the BB lower band proximity, makes me expect a bullish rebound from the support line below and a retest of the local target above at 78.53.
✅LIKE AND COMMENT MY IDEAS✅

WTI, back at major order block support -- BOUNCE expectedWTI is currently sitting at below 0.5 FIB level on a weekly data -- a key area where most buyers converge.
$65-70 area has been quite a solid order block support. It has been tested many times and oil keeps bouncing up from this range.
A bounce is expected from current price range. Accumulation has notably started increasing at the present levels.
Spotted at 69.0
TAYOR.
Safeguard capital always.
--------
RELATED NEWS: Reuters
Oil prices settle more than 3% higher after China rate cut
By Stephanie Kelly
NEW YORK, June 13 (Reuters) - Oil prices climbed over 3% on Tuesday on hopes for growing fuel demand after China's central bank lowered a short-term lending rate for the first time in 10 months, boosting crude prices after steep losses the previous session.
The rate cut is aimed at adding momentum to a hesitant post-pandemic recovery in the world's second-largest economy and biggest crude importer.
Brent crude futures settled up $2.45, or 3.4%, to $74.29 a barrel. U.S. West Texas Intermediate (WTI) crude gained $2.30, or 3.4%, at $69.42 a barrel.

Usoil buyUsoil looking perfect time to buy in cheap price 1:2 RR 200 pips target in this analysis keep calm keep hold

Oil ScenarioThis is a simple project that is looking for two possible scenarios in the unfolding of events. The most important phenomenon that will be relevant in analyzing and possibly trading this instrument using the elements in the snapshot, is the price action at the shapes. If coincidences of price action near the shapes or icons occur, we can treat them as potential pivot points, reversal signals.
This is very straight forward and easy to trade when a potential Japanese Candlestick reversal pattern forms. You trade in the direction of the signal candlestick, using stop loss below its low, or above its high, and my personal preferred method of trailing stop loss, is to use the highs and lows of newer longer candlesticks in the wave that we are riding, that provide new lower lows or higher highs. /This method is highlighted with purple in the past price action as an example, but other methods can be used, as this is likely to get us out of the position, earlier than the actual end of the wave we are riding. This is a discretionary approach and anyone should use their own knowledge and wisdom of the markets to trade accordingly with their preferred and suitable strategy for their trading account.
One other option would be to stay in the position until a tradable reversal signal occurs, reversing the position, but this could encounter duds, where signals are not successful, a case in which you are left out of the market, leaving money on the table.
Leaving the position managing aspect aside (which could actually be more relevant than entry points), this project is considering two main scenarios: a short at the green rectangle with relevant price action that might signal a reversal, or a long position taken somewhere at the red rectangle after a bullish engulfing or other candlestick pattern. The rectangles are potential support and resistance zones. The target above 96 might be too bold, but it is important to acknowledge that price action, many times, is much more important than our perception of what should or could happen. What is happening, is much more important than our imagination. /That is why I prefer the Japanese Candlesticks type of analysis, because they tell their own story of reality: highs, lows, momentum, sentiment, etc.

CRUDE OIL Support Ahead! Buy!
Hello,Traders!
CRUDE OIL is going down
To rertest the horizontal
Support below at 75.97$
And after the retest we
Will be expecting a
Local bullish rebound
Buy!
Like, comment and subscribe to help us grow!
Check out other forecasts below too!

USOIL SHORT
The price may rise to $82 but could also fall to about $70.
101.9 million barrels of oil will be consumed worldwide per day.
By next year, the oil markets appear to be oversupplied.
Highlights
Lower Russian output and more demand brought on by China's reopening could help oil prices.
Low demand and a bleak macroeconomic outlook for China
When the Energy Information Administration releases its inventory figures on Wednesday, more oil-related information will be available.
- ---------------
**First Scenario - Long:**
Initial Target: $80.90
Entry: $79.08
Stoploss: $77.47
**Second Scenario - Short:**
Initial Target: $74
Entry: $78.34
Stoploss: $79.2
- ---------------
After a long wait, I am currently waiting for this pair to give me my confirmation for a Short position (Data)
- ---------------
Take into consideration:
It appears that the market has settled in a range of $79.44 to $76.86, with the 7.68 retracement level above the latter being significant.
- ---------------
NFA
DYOR
- ---------------
Good Luck!
⚠️Caution: Just because I've set my buy and sell position Settings or drawn direction lines on my chart doesn't indicate I've opened a position or am obsessed with a particular bias. This is only a forecast; I don't trade when the price reaches my level; I have rules of engagement. Perhaps the most crucial element is 🆘RISK MANAGEMENT🆘.

USOIL - COT data suggests institutional sellingWhile FXCM and IG retail sentiment remains bullish for USOIL, institutions have started to become bearish from May 20th, with majority of leveraged funds and hedge funds accumulating short positions on WTI, USOIL. This likely means further downside is likely for USOIL. Order book analysis suggests there are plenty of market depth on the DOM at approx. 70.8 levels.

USOIL Will Go Up From Support! Long!
Take a look at our analysis for USOIL.
Time Frame: 12h
Current Trend: Bullish
Sentiment: Oversold (based on 7-period RSI)
Forecast: Bullish
The market is approaching a key horizontal level 77.11.
Considering the today's price action, probabilities will be high to see a movement to 79.91.
P.S
We determine oversold/overbought condition with RSI indicator.
When it drops below 30 - the market is considered to be oversold.
When it bounces above 70 - the market is considered to be overbought.
Like and subscribe and comment my ideas if you enjoy them!

USOIL Set To Grow! BUY!
My dear followers,
This is my opinion on the USOIL next move:
The asset is approaching an important pivot point 77.12
Bias - Bullish
Safe Stop Loss - 76.27
Technical Indicators: Supper Trend generates a clear long signal while Pivot Point HL is currently determining the overall Bullish trend of the market.
Goal - 78.52
About Used Indicators:
For more efficient signals, super-trend is used in combination with other indicators like Pivot Points.
———————————
WISH YOU ALL LUCK

WTI CRUDE OIL: Opportunities to profit sideways.WTI Crude Oil turned bearish on its 1D technical outlook (RSI = 39.681, MACD = -1.020, ADX = 30.568) but remains neutral on 1W (RSI = 46.231) as it is approaching again the 1W MA200. That is a critical Support as not only it is untouched since February 5th but is the long term level that Oil has been bouncing aggressively on since March 2023. We look towards a Rectangle consolidation-accumulation as the last two times that the 1W MA200 was tested. We will buy on S1 and target the R1 level (TP = 80.60). Until we close over the 1D MA50, our strategy is to scalp this range.
## If you like our free content follow our profile to get more daily ideas. ##
## Comments and likes are greatly appreciated. ##

US OIL Trading RecommendationInstrument: USOIL
Position: Buy
Entry: 77.00
1st Target: 79.00
2nd Target: 80.50
Stop Loss: 76.00
Take Profit: 75.00
Rationale:
USOIL is exhibiting signs of a bullish trend, supported by recent price action and fundamental factors.
Targets:
Our primary target stands at 79.00, representing a significant resistance level where we anticipate a price reaction. The secondary target is positioned at 80.50, indicating further potential upside momentum.
Stop Loss:
To manage risk effectively, a stop loss is placed at 76.00, just below the anticipated support level. This ensures a controlled exit in case of unexpected market movements.
Take Profit:
In the event of a breakdown below 76.00, the take profit level is set at 75.00, reflecting a potential reversal in the market sentiment.
Disclaimer:
Trading carries inherent risks, and this recommendation should be considered alongside individual risk tolerance and market analysis. It is advisable to employ proper risk management techniques, including the use of stop-loss orders, to mitigate potential losses.

WTI Oil H4 | Falling to swing-low supportWTI oil (USOIL) is falling towards a swing-low support and could potentially bounce off this level to climb higher.
Buy entry is at 76.59 which is a swing-low support.
Stop loss is at 75.93 which is a level that lies underneath a swing-low support and the 100.0% Fibonacci projection level.
Take profit is at 78.47 which is a pullback resistance that aligns with the 50.0% Fibonacci retracement level.
High Risk Investment Warning
Trading Forex/CFDs on margin carries a high level of risk and may not be suitable for all investors. Leverage can work against you.
Stratos Markets Limited (www.fxcm.com):
CFDs are complex instruments and come with a high risk of losing money rapidly due to leverage. 68% of retail investor accounts lose money when trading CFDs with this provider. You should consider whether you understand how CFDs work and whether you can afford to take the high risk of losing your money.
Stratos Europe Ltd, previously FXCM EU Ltd (www.fxcm.com):
CFDs are complex instruments and come with a high risk of losing money rapidly due to leverage. 70% of retail investor accounts lose money when trading CFDs with this provider. You should consider whether you understand how CFDs work and whether you can afford to take the high risk of losing your money.
Stratos Trading Pty. Limited (www.fxcm.com):
Trading FX/CFDs carries significant risks. FXCM AU (AFSL 309763), please read the Financial Services Guide, Product Disclosure Statement, Target Market Determination and Terms of Business at www.fxcm.com
Stratos Global LLC (www.fxcm.com):
Losses can exceed deposits.
Please be advised that the information presented on TradingView is provided to FXCM (‘Company’, ‘we’) by a third-party provider (‘TFA Global Pte Ltd’). Please be reminded that you are solely responsible for the trading decisions on your account. There is a very high degree of risk involved in trading. Any information and/or content is intended entirely for research, educational and informational purposes only and does not constitute investment or consultation advice or investment strategy. The information is not tailored to the investment needs of any specific person and therefore does not involve a consideration of any of the investment objectives, financial situation or needs of any viewer that may receive it. Kindly also note that past performance is not a reliable indicator of future results. Actual results may differ materially from those anticipated in forward-looking or past performance statements. We assume no liability as to the accuracy or completeness of any of the information and/or content provided herein and the Company cannot be held responsible for any omission, mistake nor for any loss or damage including without limitation to any loss of profit which may arise from reliance on any information supplied by TFA Global Pte Ltd.
The speaker(s) is neither an employee, agent nor representative of FXCM and is therefore acting independently. The opinions given are their own, constitute general market commentary, and do not constitute the opinion or advice of FXCM or any form of personal or investment advice. FXCM neither endorses nor guarantees offerings of third-party speakers, nor is FXCM responsible for the content, veracity or opinions of third-party speakers, presenters or participants.

US-Oil will further push upside After Testing TrendlineHello Traders
In This Chart XTIUSD HOURLY Forex Forecast By FOREX PLANET
today XTIUSD analysis 👆
🟢This Chart includes_ (XTIUSD market update)
🟢What is The Next Opportunity on XTIUSD Market
🟢how to Enter to the Valid Entry With Assurance Profit
This CHART is For Trader's that Want to Improve Their Technical Analysis Skills and Their Trading By Understanding How To Analyze The Market Using Multiple Timeframes and Understanding The Bigger Picture on the Charts
