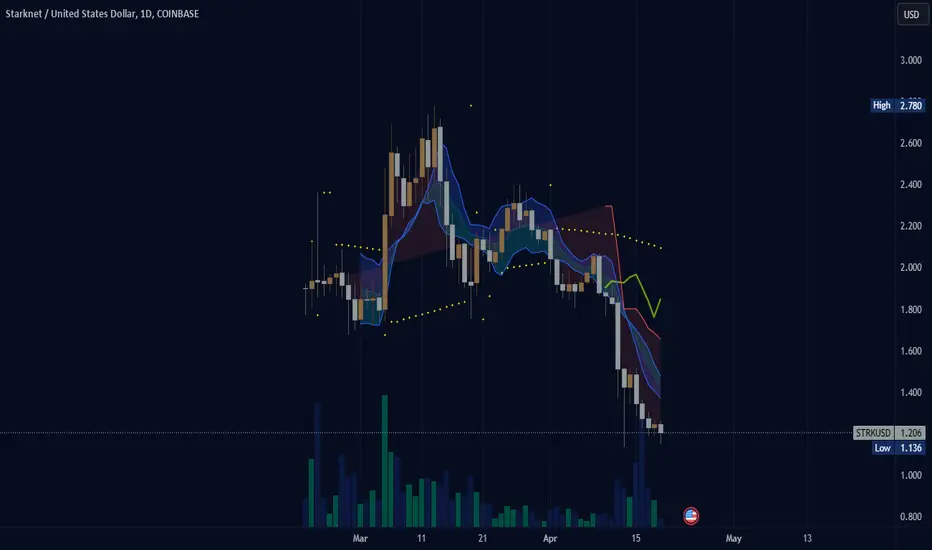
STRKUSD Bullish Study Case
On the daily timeframe, STRK was in a bearish trend. Then, it started forming the Wyckoff accumulation pattern, which included a bearish candle with a long wick, marked on the graph as SC for Selling Climax. Then, we had the AR for Automatic Reaction, followed by the ST for Secondary Test, UT for
Key stats
About Starknet

(STRK) starknet tokenStarknet token on Base chain. Is it a viable contender in the future for cryptocurrency? I do'nt see why not. Why would coinbase add this token to their ... does Coinbase add or do people build on Base whether Base likes it or not? There was a problem with Binance Chain now BNB chain in the past wit
STRK-USD: StarkNet ready to excel?2024-03-11 Starknet STRK
Starknet is a coin that has been on major exchanges for only a few weeks.
Some analysts speak highly of it, as potential multiplier of our funds.
After some struggles getting a footing, it appears ready for a breakout for 2x gain.

$STRK upside $4-9?IDX:STRK looks like it has the potential to make a strong move here. It has a very similar look to SPARKS:AERO before it went up ~7x.
While I don't think it'll be as strong of a move, I do think there's good potential for upside.
Let's see what happens. Price needs to confirm resistance as supp

See all ideas
Frequently Asked Questions
The current price of Starknet (STRK) is 1.337 USD — it has risen 3.24% in the past 24 hours. Try placing this info into the context by checking out what coins are also gaining and losing at the moment and seeing STRK price chart.
The current market capitalization of Starknet (STRK) is 1.74 B USD. To see this number in a context check out our list of crypto coins ranked by their market caps or see crypto market cap charts.
Starknet (STRK) trading volume in 24 hours is 217.67 M USD. See how often other coins are traded in this list.
Starknet price has risen by 7.30% over the last week, its month performance shows a 2.12% decrease, and as for the last year, Starknet has decreased by 29.63%. See more dynamics on STRK price chart.
Keep track of coins' changes with our Crypto heatmap.
Keep track of coins' changes with our Crypto heatmap.
Starknet (STRK) reached its highest price on Mar 13, 2024 — it amounted to 2.780 USD. Find more insights on the STRK price chart.
See the list of crypto gainers and choose what best fits your strategy.
See the list of crypto gainers and choose what best fits your strategy.
Starknet (STRK) reached the lowest price of 1.020 USD on May 20, 2024. View more Starknet dynamics on the price chart.
See the list of crypto losers to find unexpected opportunities.
See the list of crypto losers to find unexpected opportunities.
The current circulating supply of Starknet (STRK) is 10.00 B USD. To get a wider picture you can check out our list of coins with the highest circulating supply, as well as the ones with the lowest number of tokens in circulation.
Starknet has the limit of 10.00 B coins. No matter how the currency evolves, no new coins will be released after this number is reached.
The safest choice when buying STRK is to go to a well-known crypto exchange. Some of the popular names are Binance, Coinbase, Kraken. But you'll have to find a reliable broker and create an account first. You can trade STRK right from TradingView charts — just choose a broker and connect to your account.
Starknet (STRK) is just as reliable as any other crypto asset — this corner of the world market is highly volatile. Today, for instance, Starknet is estimated as 5.69% volatile. The only thing it means is that you must prepare and examine all available information before making a decision. And if you're not sure about Starknet, you can find more inspiration in our curated watchlists.
You can discuss Starknet (STRK) with other users in our public chats, Minds or in the comments to Ideas.