HDFCAMC BRAKEOUTNSE:HDFCAMC
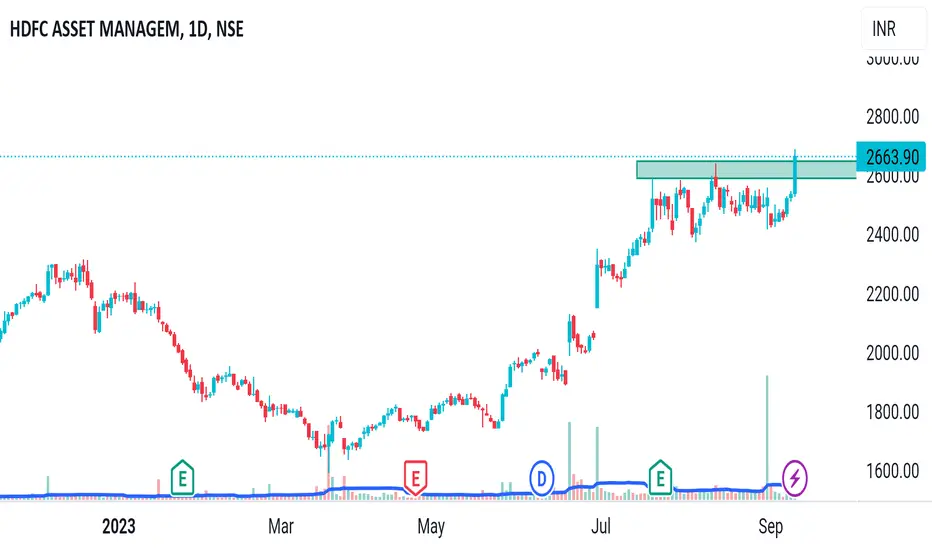
HDFCAMC gives brake out on daily chart.
BUY RATE 3950-4000
SL 3860
Target 4300+
HDFCAMC trade ideas

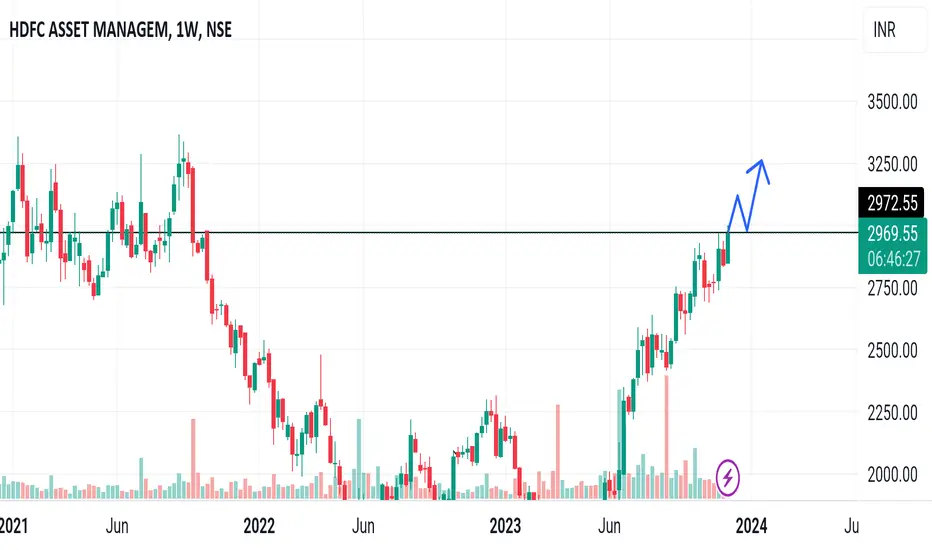
HDFCAMC ready for new highson a daily time frame we can see a breakout in HDFCAMC, in upcoming days we can see a new highs in HDFCAMC

HDFCAMC: A Trading OpportunityAs a technical analyst, I'm excited to share my latest findings on HDFCAMC, a stock listed on the National Stock Exchange (NSE).
After conducting a thorough analysis, I've identified a unique trading opportunity that presents itself at the intersection of strong support and resistance lines.
The Setup
HDFCAMC has been trading within a well-defined range over the past three months, with a strong support line in place. This support line has been tested multiple times, and each time, the stock has bounced back, indicating a high degree of buying interest.
Furthermore, a one-week horizontal support line has also been established, providing additional confirmation of the stock's underlying strength.
The Resistance Line
The resistance line, on the other hand, appears to be a promising area of potential breakout. With a strong volume profile, this line has the potential to be broken out of, leading to a significant move upwards.
This presents a trading opportunity for both long and short positions, depending on the price action around the support and resistance lines.
Trading Opportunities
For traders looking to go long, the current setup presents a high-reward, low-risk opportunity. With the stock trading near the support line, a breakout above the resistance line could lead to a significant move upwards, potentially targeting the next resistance level.
For short sellers,
the setup is equally attractive, as a breakdown below the support line could lead to a decline, potentially targeting the next support level. Key Levels to Watch To take advantage of this trading opportunity, traders should focus on the following key levels:
Support Line (3-month): 3,700
Horizontal Support Line (1-week): 3,580
Resistance Line: 3,800
Conclusion
HDFCAMC presents a unique trading opportunity at the intersection of strong support and resistance lines. With a well-defined range in place and a promising resistance line, traders can take advantage of this setup to go long or short, depending on their market view. As always, it's essential to monitor the price action closely and adjust trading strategies accordingly. For those looking to take advantage of this opportunity, I recommend setting stop-loss orders and adjusting position sizes based on market conditions.
Disclaimer
This analysis is for informational purposes only and should not be considered as investment advice. Trading carries risk, and it's essential to do your own research and consult with a financial advisor before making any investment decisions.


HDFCAMC- Technical and Fundamental ( Concall summary)NSE:HDFCAMC
📈 #HDFCAMC Performance Update
1/🧵 AUM Growth 🌟: A strong year for HDFC AMC with a 20% YoY increase in quarterly average AUM, hitting a record INR 47 trillion. Equity-oriented funds grew by 26% YoY, reaching INR 23.1 trillion. #AUMGrowth #EquityFunds
2/🧵 Debt Funds Surge 💰: The quarter saw debt funds' AUM rise to INR 10.3 trillion. The B30 MAAUM category also showed significant growth, indicating rising mutual fund acceptance in these markets. #DebtFunds #MarketExpansion
3/🧵 Record-Breaking AUM 🚀: For the first time, the company's quarterly average AUM crossed INR 5 trillion, reaching INR 5.25 trillion - a 22% YoY growth. #RecordGrowth #FinancialMilestones
4/🧵 Market Share Momentum 📈: HDFC AMC’s market share continues to rise, with an overall QAAUM market share of 11.2% and 12.5% excluding ETFs. #MarketShare #InvestmentGrowth
5/🧵 Equity-Oriented Focus 🌐: The company's asset mix is now more equity-oriented, making up 58% of the total AUM. Also, its unique investor base expanded to 7.9 million by September 2023. #EquityFocus #InvestorBase
🆕 New Product Launches
6/🧵 Diverse Offerings 🛍️: HDFC AMC launched various new funds, including non-cyclical consumer, transportation & logistics, technology, and pharma & healthcare funds. #FundLaunch #Diversification
💹 Financial Performance Insights
7/🧵 Revenue and Profit Surge 💸: The company’s revenue from operations for Q2 grew by 18% YoY to INR 6.43 billion, while operating profit increased by 20% YoY to INR 4.67 billion. #RevenueGrowth #ProfitIncrease
8/🧵 Cost Dynamics 💼: Staff costs rose by 11% YoY, and other expenses grew by 22% YoY. #OperationalCosts #FinancialHealth
🔄 Marketing and Distribution Strategies
9/🧵 Long-term Investing Focus 🔄: HDFC AMC emphasizes SIP and systematic transactions for disciplined, long-term investing. #SIP #LongTermInvestment
10/🧵 Strengthening Partnerships 🤝: The company is enhancing its collaboration with HDFC Bank to leverage the bank’s distribution network, adding a dedicated vertical for this channel. #StrategicPartnerships #BankingNetwork
11/🧵 Market Share Gains 📊: A combination of performance, product range, and distribution efforts has led to market share gains, particularly in SIP flows and unique investors. #MarketShare #InvestorGrowth
12/🧵 Customer-Centric Approach 🧑💼: The company's focus on individual customers has resulted in increased folios and average AUM per folio, with higher flow market share in HDFC Bank. #CustomerFocus #GrowthStrategy
🔍 Other Key Highlights
13/🧵 Dividends and Future Plans 💼: HDFC AMC expects an upward trend in dividend payout ratios and plans to launch new funds, subject to regulatory approvals. #Dividends #FuturePlans
14/🧵 Passive Investment Strategy 🛠️: The company is expanding its product offerings in the passive space while maintaining a balance with active investment strategies. #ETFs #InvestmentApproach
15/🧵 Cost and Guidance Outlook 🔭: Expectations are for employee costs to increase annually by high-single-digit or low-double-digit percentages. No specific guidance provided for the upcoming financial year. #CostOutlook #FutureGuidance
📈 Chart analysis
16/🧵Sharing my trances, and hopefully, the stock move towards the key levels with some strong financial performance in coming weeks and months
🔚 Stay tuned for more updates and insights on HDFC Asset Management and follow Peaceful Weekend Investing and your friend Shivendra Bhatia
#HDFCAMC #InvestingJourney

HDFC Asset Management (AMC) swing setup LongHDFCAMC has been trading in an uptrend for the past few months, forming a cup pattern. It has reached its all-time high. The monthly, weekly and daily RSI is above 60 and taking support at 60 levels in 75-minute time frame. You can see that the volume is also moderate. If it starts increasing as the price approaches its all-time high ( 3844), there would be a high probability trade for a small risk-to-reward ratio (1:2.5). One can also hold if it breaks the all-time high as there would be no resistance above 3844.

HDFCAMC in 75min ChartHDFC AMC looking to break triangle in 75 min chart, could be a good trade for short term.

Hdfc amchdfc amc is looking bearish on Daily TF. it is goes below 1818. take short position . with proper sl. will have a gud target in short term.

HDFCAMC - Bullish patternHDFCAMC - Elliott Wave count
the market is in wave C with the target of 4000 range. its better to wait for correction to take long position.
Please note that this information is for educational purposes only, and it is crucial to trade with caution.
NSE:HDFCAMC NSE:HDFCAMCZ2023 BSE:HDFCAMC


HDFCAMCThese are swing ideas which you can add your watchlist and analysis for yourself !
Keep on your radar!
This content only education purpose!
❗I am not sebi ragister❗
HDFCAMC DAILY CHARTHDFCAMC exhibits a fresh breakout on daily chart, with upside potential of 3027 levels, which is 30% appreciation from current levels.
Its only an observation & not any suggestion.

HDFC AMCHDFC AMC very strong for long side very Bullish upcomings day Stoploss near 1588and target as 1890 2nd target possible 2050 next 6 month Hdfc amc Now price 1784

HDFCAMC nice beautiful cup & handle pattern formationHDFCAMC will be going to make a nice beautiful cup & handle pattern formation. After Expected will be brake out will have the potential to reach 4300 .
Target 4340
#LEARNING
#PATIENCE #HDFCAMC

HDFCAMC looking good for swing trade1. Trendline Support
2. Prev Resistance acting as support
3. At 20 EMA Support
4. At FIB golden retracement zone
5. Ascending Triangle pattern at 1 hour TF

There is still chance to catch this move!
Still HDFC AMC is 300% down from it's peak and it is about to give breakout.
It is sitting at his highest ever profit and revenues so no doubt about it's fundamentals and profitability.
In the most near tern it is about to give you 11% return. Half rally is done but still most of the rally is left.
If you find this new and informative please boost this.

Level good for straddles with hedgeFrom thia point it will breakout or breakdown. Good point for hedged straddles.
Stop loss and hedge must.

Best bet for short-term and long-term as well.
The stock is forming double bottom pattern and it is exactly rebound by forming it.
This is the chart pattern from this. We can define our target And also, it was rebounded from a strong support.
The target of the stock should Of the height of the double bottom pattern.
The main reason that I'm saying that this is short term and long term is in the short term it can surely achieve its Double Bottom pattern Target.
And in the long run it can go to its previous high so we can expect 20% minimum gain from this point And that too, in the short term.
If you find this valuable please do follow me and make sure you like this.

TRIANGLE breakout in HDFC AMCElliott Wave Analysis:-
Triangle breakout has happened and retracement is taking place.
with 2649.35 as stop loss we can get entry at current level.
Target
1. it has to cross 2737
2. 2772
3. 2800 - 2854
if the C wave was broken downside then the triangle may be in reverse and the fall will be the size of the A wave we marked.

HDFC AMC BREAKOUT Hdfc Amc Breakout
Buy for Target 2800 to 2900
For swing trading within a month or 2 months
Stop loss 2400
For Everyday Updates follow me.
Look for the target of 2900 by the end of financial year. Made base foundation at 1600. Reveresal from trendline.
Now ready to take off after forming double bottom.

Descending Triangle breakdown in HDFCAMCHDFC ASSET MANAGMENT COMPANY LTD
Key highlights: 💡⚡
✅On1Hour Time Frame Stock Showing Breakdown of Descending Triangle Pattern .
✅ Strong bearish Candlestick Form on this timeframe.
✅It can give movement up to the Breakdown target of 2345-.
✅Can Go short in this stock by placing a stop loss above 2510+.

hdfamc , ready to go up Markets regulator SEBI on Wednesday deferred a proposal on standard investor fees by mutual funds
** SEBI had in May proposed that mutual fund houses charge standardised fees from investors to ensure greater transparency
