ADSK trade ideas

Autodesk Squeezes After Strong ReportAutodesk has been squeezing near a two-year high, and some traders may expect a breakout soon.
The first pattern on today’s chart is the attempted rally on March 1 after earnings, revenue and guidance beat estimates. A falling trendline appeared as the software company pulled back, but it’s now pushing above that resistance.
Second, prices have held the rising 50-day simple moving average. That may reflect a bullish intermediate-term trend.
Third, the 8-day-exponential moving average (EMA) recently crossed above the 21-day EMA. (See our 2 MA Ratio custom script in the lower study.) That may reflect a bullish short-term trend.
Fourth, the December 27 high of $245.88 was ADSK’s peak all of last year. The stock bounced near that level on March 5. Has old resistance become new support?
Next, stochastics are rebounding from an oversold condition.
Finally, ADSK hasn’t been an actively traded stock for years because of its focus on markets like industrial design. However, management discussed AI potential in its last quarterly report. Could that change the fundamental narrative with investors?
TradeStation has, for decades, advanced the trading industry, providing access to stocks, options and futures. See our Overview for more.
Past performance, whether actual or indicated by historical tests of strategies, is no guarantee of future performance or success. There is a possibility that you may sustain a loss equal to or greater than your entire investment regardless of which asset class you trade (equities, options or futures); therefore, you should not invest or risk money that you cannot afford to lose. Online trading is not suitable for all investors. View the document titled Characteristics and Risks of Standardized Options at www.TradeStation.com . Before trading any asset class, customers must read the relevant risk disclosure statements on www.TradeStation.com . System access and trade placement and execution may be delayed or fail due to market volatility and volume, quote delays, system and software errors, Internet traffic, outages and other factors.
Securities and futures trading is offered to self-directed customers by TradeStation Securities, Inc., a broker-dealer registered with the Securities and Exchange Commission and a futures commission merchant licensed with the Commodity Futures Trading Commission). TradeStation Securities is a member of the Financial Industry Regulatory Authority, the National Futures Association, and a number of exchanges.
TradeStation Securities, Inc. and TradeStation Technologies, Inc. are each wholly owned subsidiaries of TradeStation Group, Inc., both operating, and providing products and services, under the TradeStation brand and trademark. When applying for, or purchasing, accounts, subscriptions, products and services, it is important that you know which company you will be dealing with. Visit www.TradeStation.com for further important information explaining what this means.

ADSK 2023-03-18 looks bullishsNASDAQ:ADSK
- Consolidate around EMA12 & SMA25 for a while
- Relative strength looks good in comparison to other stocks in S&P, didn't go down a lot with the market.
- Looks like it is waiting for a breakout
- low risk entry to be entered here.

Long-term position in Autodesk, Inc $ADSKI have entered a long-term position in Autodesk, Inc NASDAQ:ADSK
Timeframe: M
SL: ~$199
Target: ~$380

Triangle busted, look for around $256Symmetrical Triangle busted. I'm looking for around 10% upside from the top of the triangle. Which is around $256.
Also, from past trend it seems we have resistance at around that level.

ADSK 2-Year Resistance Flipped to SupportADSK has recently broken out above it's moving averages, and flipped a long term resistance level at $235 into support, and is now expanding after two years of accumulation.

ADSK - 16 months RECTANGLE══════════════════════════════
Since 2014, my markets approach is to spot
trading opportunities based solely on the
development of
CLASSICAL CHART PATTERNS
🤝Let’s learn and grow together 🤝
══════════════════════════════
Hello Traders ✌
After a careful consideration I came to the conclusion that:
- it is crucial to be quick in alerting you with all the opportunities I spot and often I don't post a good pattern because I don't have the opportunity to write down a proper didactical comment;
- since my parameters to identify a Classical Pattern and its scenario are very well defined, many of my comments were and would be redundant;
- the information that I think is important is very simple and can easily be understood just by looking at charts;
For these reasons and hoping to give you a better help, I decided to write comments only when something very specific or interesting shows up, otherwise all the information is shown on the chart.
Thank you all for your support
🔎🔎🔎 ALWAYS REMEMBER
"A pattern IS NOT a Pattern until the breakout is completed. Before that moment it is just a bunch of colorful candlesticks on a chart of your watchlist"
═════════════════════════════
⚠ DISCLAIMER ⚠
The content is The Art Of Charting's personal opinion and it is posted purely for educational purpose and therefore it must not be taken as a direct or indirect investing recommendations or advices. Any action taken upon these information is at your own risk.

ADSK Autodesk Options Ahead of EarningsIf you haven`t bought ADSK ahead of the previous earnings:
Then analyzing the options chain and the chart patterns of ADSK Autodesk prior to the earnings report this week,
I would consider purchasing the 210usd strike price Puts with
an expiration date of 2023-11-24,
for a premium of approximately $4.00.
If these options prove to be profitable prior to the earnings release, I would sell at least half of them.
Looking forward to read your opinion about it.

Long ADSKA harmonic ABCD pattern has formed on ADSK stock, with a target of the 212$ resistance zone.
A divergence between price and MACD Histogram has occurred.

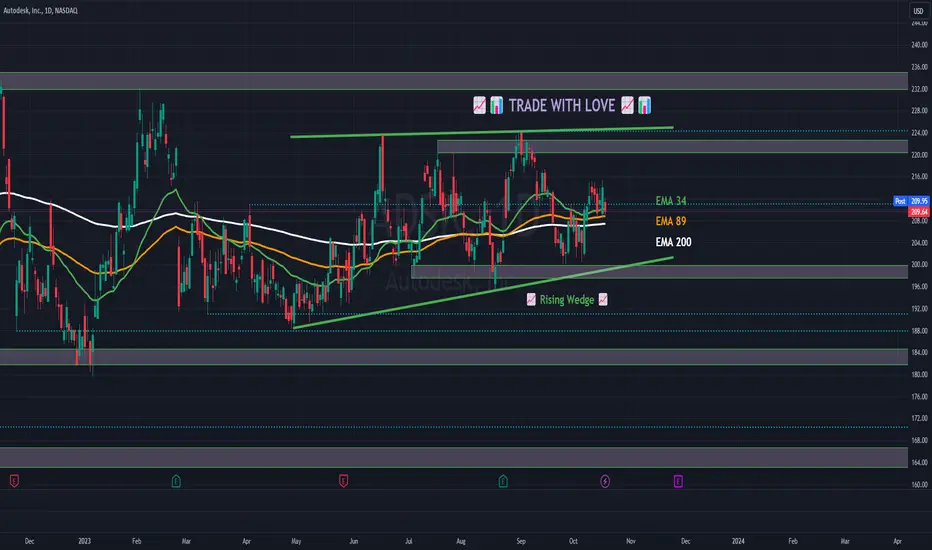
📈📊 #ChartPattern Alert! 📈📊 📈 Rising Wedge 📈📈 What is a Rising Wedge? The Rising Wedge is a bearish chart pattern characterized by two converging trendlines, with the lower trendline sloping upward more than the upper trendline. It typically signals a potential bearish reversal, with the price likely to break downward after the wedge pattern.
📈 How to Identify:
Draw a trendline connecting at least two lower highs (upper trendline).
Draw another trendline connecting at least two lower lows (lower trendline).
📈 What it Signals: The Rising Wedge suggests a potential bearish reversal, with sellers prevailing at lower highs within the wedge. It often forms during uptrends and can precede a significant price move to the downside.
📈 Trade Strategy:
Consider short-selling or setting stop-loss levels if the price breaks below the lower trendline of the Rising Wedge.
Set profit targets based on the pattern's height subtracted from the breakdown point.
Implement a stop-loss to manage risk in case of a false breakdown.
Remember to use other technical indicators and conduct thorough research to support your analysis before making any trading decisions. Happy charting and trading! 📉💹
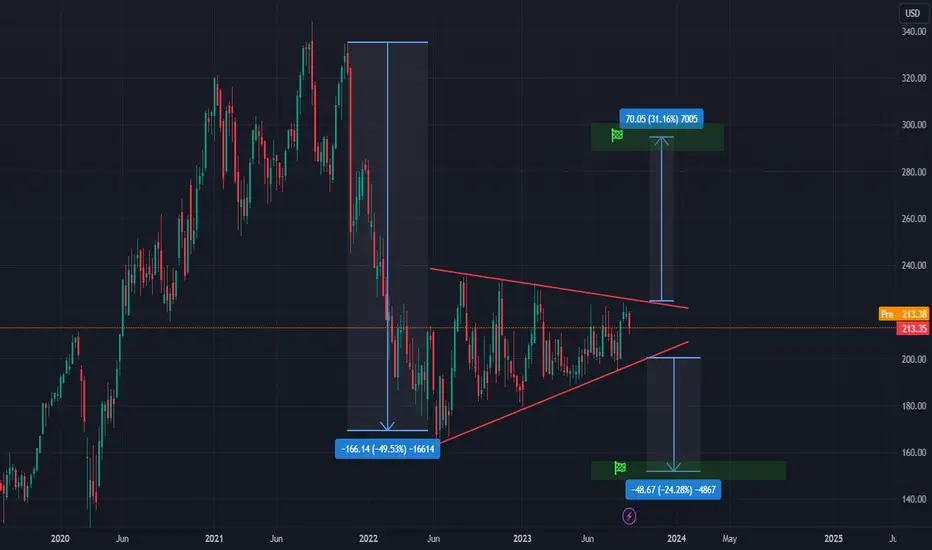
Autodesk in Year long pattern hi traders
Autodesk (ADSK) is trading in already a one year long pattern.
We are still waiting for a breakout which may indicate strong move in the breakout direction.
Enter the position once the breakout occurs.
Targets both for longs and shorts are shown on the chart
good luck
2:1 - 3:1 risk reward on $ADSK Generally cautious to take shorts with S&P in its cup and handle continuation pattern. Especially swing shorts over many weeks. However for a simple downside continuation trade the pattern is valid. Time stop should be start of November.

ADSK Autodesk Options Ahead of EarningsAnalyzing the options chain and the chart patterns of ADSK Autodesk prior to the earnings report this week,
I would consider purchasing the 200usd strike price at the money Calls with
an expiration date of 2023-8-25,
for a premium of approximately $6.45.
If these options prove to be profitable prior to the earnings release, I would sell at least half of them.
Looking forward to read your opinion about it.

Short AutodeskA nice compression has formed on the daily Autodesk chart. Since we're in a downtrend, a continuation of the trend is expected.

AUTODESK expecting new bullish push soon
Hi viewers, ADSK price break first zone, in last 2 days of week its be bearish, currently here for next periods new bullish push soon expecting
TP1: 127
TP2: 137

ADSK to recoverADSK is one of the companies affected by the AI revolution. However I think investors are neglecting the fact that ADSK is investing heavily in AI, judging by the R&D investment as percent of sales.

Channel DownChannels can be broken in a heartbeat as of late.
Also a large rectangle/dashed line at rectangle support.
Earnings miss
no recommendation/pocket pivots noted

$ADSK looking for relative equal high targetNASDAQ:ADSK currently respecting weekly FVG with liquidity draw to the top side. Currently in consolidation


ADSK levelslooking for the break of $202 to go long on this name.
Small triangle in what could be a bigger one.
Supply zone at $214-210, so I would take most profits off there. good name!


RectangleNeutral pattern until broken.
Earnings 2-24
No recommendation.
EPS (FWD)
6.59
PE (FWD)
33.71
Div Rate (TTM)
-
Yield (TTM)
-
Short Interest
1.06%
Market Cap
$47.94B
