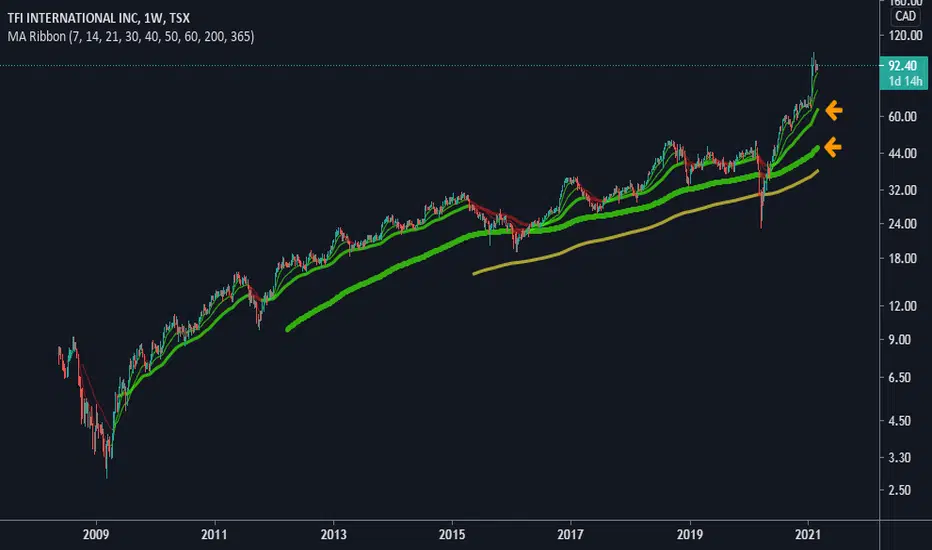
WE LIKE THE TRANSPORTSTFI International looks good. A lot of transports stocks look good here.
But, I don't think you can rule out another sell-off. It was very important the S&P and NQ rallied right before the end of the month, and if they can rally again that would go a long way to re-establishing some faith.
I think
7.93CAD
681.43 MCAD
10.15 BCAD
79.46 M
About TFI INTERNATIONAL INC
Sector
Industry
CEO
Alain Bédard
Website
Headquarters
Saint-Laurent
Employees (FY)
25.12 K
Founded
1957
ISIN
CA87241L1094
FIGI
BBG000G5FSN7
TFI International, Inc. engages in the provision of freight transportation and logistics services. It operates through the following segments: Package and Courier, Less-Than-Truckload, Truckload, and Logistics. The Package and Courier segment consists of pickup, transport, and delivery of items across North America. The Less-Than-Truckload segment offers pickup, consolidation, transport, and delivery of smaller loads. The Truckload segment comprises of expedited transportation, flatbed, tank, container, and dedicated services. The Logistics segment refers to the asset-light logistics services including brokerage, freight forwarding and transportation management, and small package parcel delivery. The company was founded in 1957 and is headquartered in Saint-Laurent, Canada.

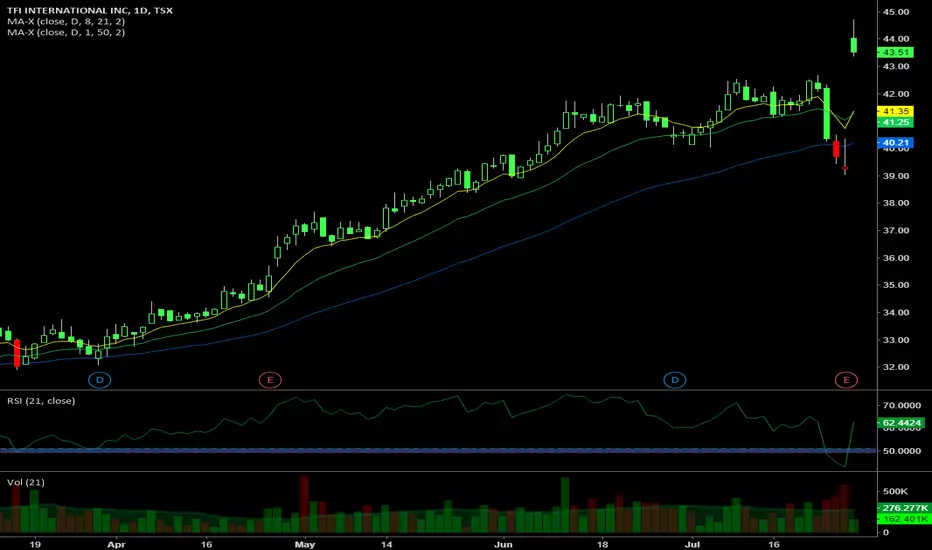
$TFII - Strong Bullish Turn - HA Morning All,
Strong Trend change on the Heikin Ashi candles for $TFII.
1. The Stock is OVERSOLD (see the RSI on the chart).
2. The Red candles length shortened before changing to green 2 days ago (MOMENTUM CHANGE INDICATION).
3. Yesterday's green candle was a strong/long length.
4. A previous resi

TFII (TFI Int. Inc) - Bullish Quarter AheadTFI International Inc. is in the transportation and logistics industry. The Company identifies strategic acquisitions and manages a network of subsidiaries. It operates principally in the United States, Canada and Mexico. TFI International Inc. is based in St Laurent, Canada.
Analysis/Commentary
St

Begining of 5th waveTo me, this looks like the begining of the 5th impulse wave. I believe it can land somewhere in that box (if it doesn’t stop at 80).
Any thoughts?

Lower oil prices in mid term will benefit trucking companies.TFI International is North American transportation and logistics leader, partnering with a diverse group of customers in the US, Canada and Mexico. The stock, TFII now trades in New York (as well as Toronto). Fuel is a large component of cost structure. I'm accumulating on down days in the market.

Canadian trucking beneficiary of protest blockadesThe stock has been pumped due to recent share issue so some 'settling down' taking place, but earnings should shoot up as rail in Canada was shut down by blockades (protesting gas pipeline) forcing customers to switch to trucking. Lower fuel costs and new NYSE listing should cause stock to rise in

See all ideas
Trade directly on the supercharts through our supported, fully-verified and user-reviewed brokers.


Curated watchlists where TFII is featured.


Frequently Asked Questions
The current price of TFII is 196.65 CAD — it has increased by 0.79% in the past 24 hours.
Depending on the exchange, the stock ticker may vary. For instance, on TSX exchange TFI INTERNATIONAL INC stocks are traded under the ticker TFII.
TFI INTERNATIONAL INC is going to release the next earnings report on Apr 25, 2024. Keep track of upcoming events with our Earnings Calendar.
TFII stock is 1.31% volatile and has beta coefficient of 1.07. Check out the list of the most volatile stocks — is TFI INTERNATIONAL INC there?
One year price forecast for TFI INTERNATIONAL INC has a max estimate of 275.45 CAD and a min estimate of 192.91 CAD.
TFII earnings for the last quarter are 2.13 CAD per share, whereas the estimation was 2.35 CAD resulting in a −9.21% surprise. The estimated earnings for the next quarter are 2.21 CAD per share. See more details about TFI INTERNATIONAL INC earnings.
TFI INTERNATIONAL INC revenue for the last quarter amounts to 2.60 B CAD despite the estimated figure of 2.55 B CAD. In the next quarter revenue is expected to reach 2.59 B CAD.
Yes, you can track TFI INTERNATIONAL INC financials in yearly and quarterly reports right on TradingView.
TFII stock has fallen by 8.54% compared to the previous week, the month change is a 5.64% fall, over the last year TFI INTERNATIONAL INC has showed a 24.65% increase.
TFII net income for the last quarter is 178.95 M CAD, while the quarter before that showed 178.84 M CAD of net income which accounts for 0.06% change. Track more TFI INTERNATIONAL INC financial stats to get the full picture.
Today TFI INTERNATIONAL INC has the market capitalization of 16.47 B, it has increased by 1.55% over the last week.
Yes, TFII dividends are paid quarterly. The last dividend per share was 0.54 CAD. As of today, Dividend Yield (TTM)% is 1.03%. Tracking TFI INTERNATIONAL INC dividends might help you take more informed decisions.
TFI INTERNATIONAL INC dividend yield was 1.07% in 2023, and payout ratio reached 24.42%. The year before the numbers were 1.13% and 12.74% correspondingly. See high-dividend stocks and find more opportunities for your portfolio.
Like other stocks, TFII shares are traded on stock exchanges, e.g. Nasdaq, Nyse, Euronext, and the easiest way to buy them is through an online stock broker. To do this, you need to open an account and follow a broker's procedures, then start trading. You can trade TFI INTERNATIONAL INC stock right from TradingView charts — choose your broker and connect to your account.
As of Apr 19, 2024, the company has 25.12 K employees. See our rating of the largest employees — is TFI INTERNATIONAL INC on this list?
Investing in stocks requires a comprehensive research: you should carefully study all the available data, e.g. company's financials, related news, and its technical analysis. So TFI INTERNATIONAL INC technincal analysis shows the sell today, and its 1 week rating is buy. Since market conditions are prone to changes, it's worth looking a bit further into the future — according to the 1 month rating TFI INTERNATIONAL INC stock shows the buy signal. See more of TFI INTERNATIONAL INC technicals for a more comprehensive analysis.
If you're still not sure, try looking for inspiration in our curated watchlists.
If you're still not sure, try looking for inspiration in our curated watchlists.
We've gathered analysts' opinions on TFI INTERNATIONAL INC future price: according to them, TFII price has a max estimate of 275.45 CAD and a min estimate of 192.91 CAD. Read a more detailed TFI INTERNATIONAL INC forecast: see what analysts think of TFI INTERNATIONAL INC and suggest that you do with its stocks.
EBITDA measures a company's operating performance, its growth signifies an improvement in the efficiency of a company. TFI INTERNATIONAL INC EBITDA is 1.58 B CAD, and current EBITDA margin is 15.58%. See more stats in TFI INTERNATIONAL INC financial statements.