2140| AyyanAyyan Investment
Cup and handle pattern.
Breakthrough 28 SR will take us 100 % to 55-60 SR from the bottom of the handle
Breakthrough 28 SR will take us 250 % to 100 SR from the bottom of the cup
Good luck!
−2.16SAR
−44.77 MSAR
266.23 MSAR
57.41 M
About AYYAN INVESTMENT CO.
Sector
Industry
CEO
Raed Mohammed Abdullatif Al-Naeem
Website
Headquarters
Al Khobar
Founded
1993
ISIN
SA0007879261
FIGI
BBG000H358Y4
AYYAN Investment Co. engages in medical operation of private and governmental hospitals and other activities related to hospital activities. It also engages in the establishment of industrial projects, ownership, and investment of real estate and land, health, education, tourism, and agricultural facilities. AYYAN Investment operates through the following sectors: Manufacturing, Medical Services, and Investment. The Manufacturing sector specializes in the production and packaging of dates. The company was founded on October 1, 1993 and is headquartered in Al Khobar, Saudi Arabia.

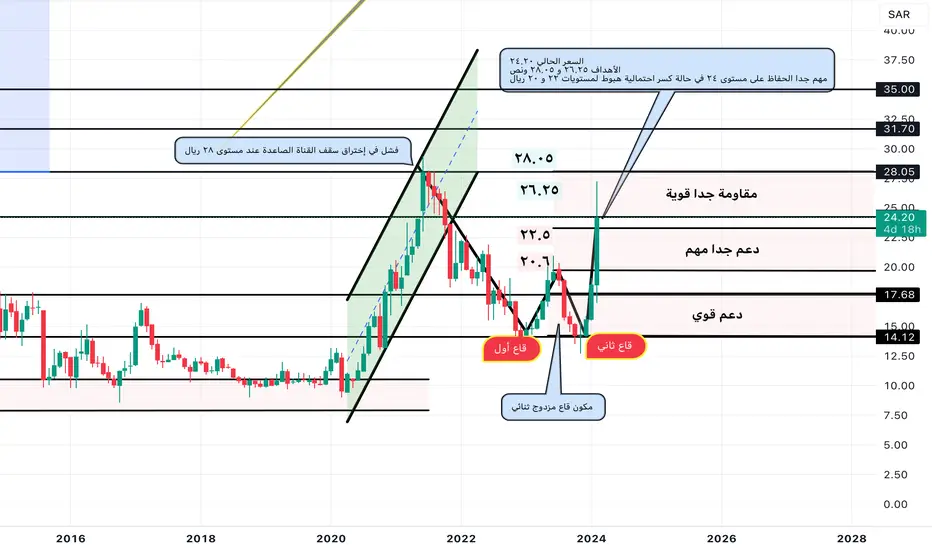
2140| AyyanAyyan
Double bottom
Trading at an important support levels
Targets: 26 and 28 SR
28 SR level is very hard and challenging resistance
22 and 20 very imports support levels
Good luck!
Please do not forget to support, cheers, like, comments and boost!
Thanks!
revisit to AYYAN stock in TASI market hi there revisit to ayyan stock in TASI market where we expect 4 wave and know we measure renounce strength

ayyan wave 4 analysis ayyan wave 4 analysis in TASI markets ( saudi arabia ) ayyan is medical company and have external investment in many fields

wave 4 analysis for ayyanwave 4 analysis for ayyan company in tasi market where is stack at wave 4 and i predicate interest prices and levels

ayyan 2140 wave analysis wave 4 targets ayyan wave analysis wave 4 targets for my dear friend
here i explain wave 4 targets and potential support

2140 to 23.02 today2140 to 23.02 today
buy 22.22
sell 23.02
stop lose 21.6
just for today
have a nice day

TADAWUL 2140 STOCK / BUY SETUPTADAWUL:2140
Hello guys please support my idea with like if you agree! Thanks!

See all ideas
Trade directly on the supercharts through our supported, fully-verified and user-reviewed brokers.


Frequently Asked Questions
The current price of 2140 is 21.06 SAR — it has decreased by 1.03% in the past 24 hours.
Depending on the exchange, the stock ticker may vary. For instance, on TADAWUL exchange AYYAN INVESTMENT CO. stocks are traded under the ticker 2140.
Yes, you can track AYYAN INVESTMENT CO. financials in yearly and quarterly reports right on TradingView.
2140 stock has risen by 1.54% compared to the previous week, the month change is a 12.61% fall, over the last year AYYAN INVESTMENT CO. has showed a 28.10% increase.
Like other stocks, 2140 shares are traded on stock exchanges, e.g. Nasdaq, Nyse, Euronext, and the easiest way to buy them is through an online stock broker. To do this, you need to open an account and follow a broker's procedures, then start trading. You can trade AYYAN INVESTMENT CO. stock right from TradingView charts — choose your broker and connect to your account.
EBITDA measures a company's operating performance, its growth signifies an improvement in the efficiency of a company. AYYAN INVESTMENT CO. EBITDA is −116.78 M SAR, and current EBITDA margin is −13.43%. See more stats in AYYAN INVESTMENT CO. financial statements.