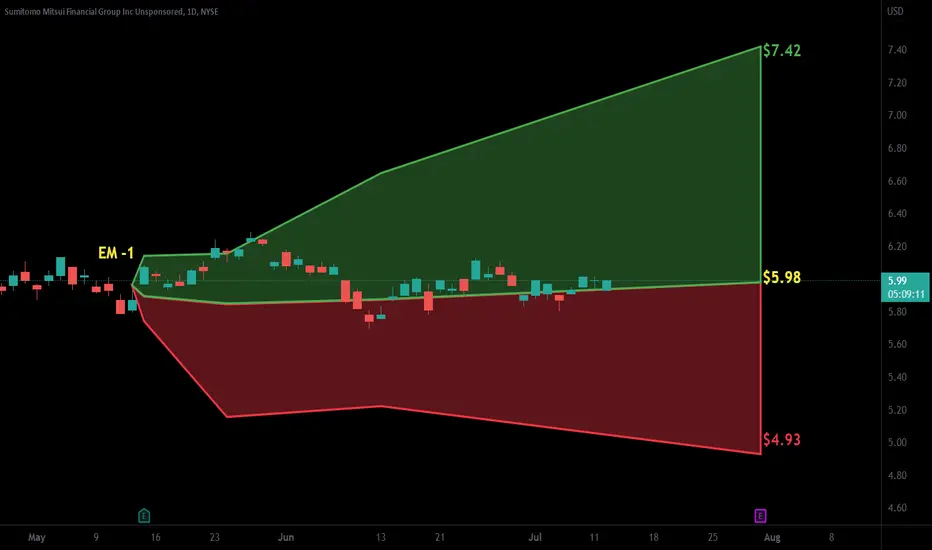
SMFG SELL+++++SMFG is way overbought, gap to fill, many stretched indicators here, RSI, AO, Stochastic RSI, bollinger bands, new moon phase began, strong resistance. We should correct under $7.40 then ultimately under $7.00 in coming days
4.01EUR
5.60 BEUR
41.70 BEUR
1.21 B
About SUMITOMO MITSUI FINANCIAL GROUP INC.
Sector
Industry
CEO
Toru Nakashima
Website
Headquarters
Tokyo
Employees (FY)
105.96 K
Founded
2002
ISIN
JP3890350006
FIGI
BBG000BG6BD6
Sumitomo Mitsui Financial Group, Inc. operates as a holding company, which engages in the management of its subsidiaries that provide financial services. It operates through the following segments: Commercial Banking, Leasing, Securities, and Consumer Finance. The Commercial Banking segment consists of consumer banking, middle market banking, wholesale banking, retail banking, international banking, and treasury units. The Leasing segment provides leasing services that include equipment, operating, leveraged, and aircraft operating leases. The Securities segment offers financial products, investment consultation and administration services to individual and corporate customers. The Consumer Finance segment handles domestic credit card business, consumer loans and loan guarantee businesses. The company was founded on December 2, 2002 and is headquartered in Tokyo, Japan.

$SMFG with a Neutral outlook following its earnings #Stocks The PEAD projected a Neutral outlook for $SMFG after a Positive over reaction following its earnings release placing the stock in drift B with an expected accuracy of 90%.

$SMFG with a Neutral outlook following its earnings #Stocks The PEAD projected a Neutral outlook for $SMFG after a Positive over reaction following its earnings release placing the stock in drift B with an expected accuracy of 88.89%.

$SMFG with a Neutral outlook following its earnings #Stocks The PEAD projected a Neutral outlook for $SMFG after a Positive over reaction following its earnings release placing the stock in drift B with an expected accuracy of 87.5%.
Stocks Stocks Stocks...Hey wolves, get ready!
Sumitomo Mitsui Financial Group Inc's price, with ticker 8316, is making symmetrical triangle on 1hr timeframe.
There was a strong bullish sentiment before. Will it be trend continuation?
According to Elliott Waves theory the price made Wave D and now is heading to Wave E.
F

$SMFG with a neutral projection following earning release$SMFG posted its earnings with a positive under reaction following its release with the PEAD projecting a neutral outlook placing the stock in Drift A
If you would like to see the Drift for another stock please message us. Also click on the Like Button if this was useful and follow us or join us.

bottom fishing with good dividend payoutA 50B+ major Japanese banking firm - coming off a major multi year base with > 25% upside in 2020. Risks can be substantially mitigated by due the high dividend payout offered by the company.
Risks can be further reduced by doing the following:
1. hedging with put options strike 5 with at least 90 D


SMFG - Bump & run formation long from $7.83 to $8.43SMFG is forming a nice bump & run formation. It has very nice upward run as a fallen angel on huge volume & now seems breaking out. Moneyflow very strong. We think it has very good upside potential.
* Trade Criteria *
Date First Found- June 12, 2017
Pattern/Why- Bump & run formation
Entry Ta

See all ideas
Trade directly on the supercharts through our supported, fully-verified and user-reviewed brokers.


Curated watchlists where XMF is featured.

Frequently Asked Questions
Depending on the exchange, the stock ticker may vary. For instance, on SWB exchange SUMITOMO MITSUI FINANCIAL GROUP INC. stocks are traded under the ticker XMF.
SUMITOMO MITSUI FINANCIAL GROUP INC. is going to release the next earnings report on May 15, 2024. Keep track of upcoming events with our Earnings Calendar.
One year price forecast for SUMITOMO MITSUI FINANCIAL GROUP INC. has a max estimate of 70.50 EUR and a min estimate of 47.21 EUR.
XMF earnings for the last quarter are 1.32 EUR whereas the estimation was 1.08 EUR which accounts for 22.23% surprise. Estimated earnings for the next quarter are 0.98 EUR. See more details about SUMITOMO MITSUI FINANCIAL GROUP INC. earnings.
SUMITOMO MITSUI FINANCIAL GROUP INC. revenue for the last quarter amounts to 5.96 B EUR despite the estimated figure of 5.51 B EUR. In the next quarter revenue is expected to reach 5.46 B EUR.
Yes, you can track SUMITOMO MITSUI FINANCIAL GROUP INC. financials in yearly and quarterly reports right on TradingView.
Like other stocks, XMF shares are traded on stock exchanges, e.g. Nasdaq, Nyse, Euronext, and the easiest way to buy them is through an online stock broker. To do this, you need to open an account and follow a broker's procedures, then start trading. You can trade SUMITOMO MITSUI FINANCIAL GROUP INC. stock right from TradingView charts — choose your broker and connect to your account.
As of Apr 16, 2024, the company has 105.96 K employees. See our rating of the largest employees — is SUMITOMO MITSUI FINANCIAL GROUP INC. on this list?