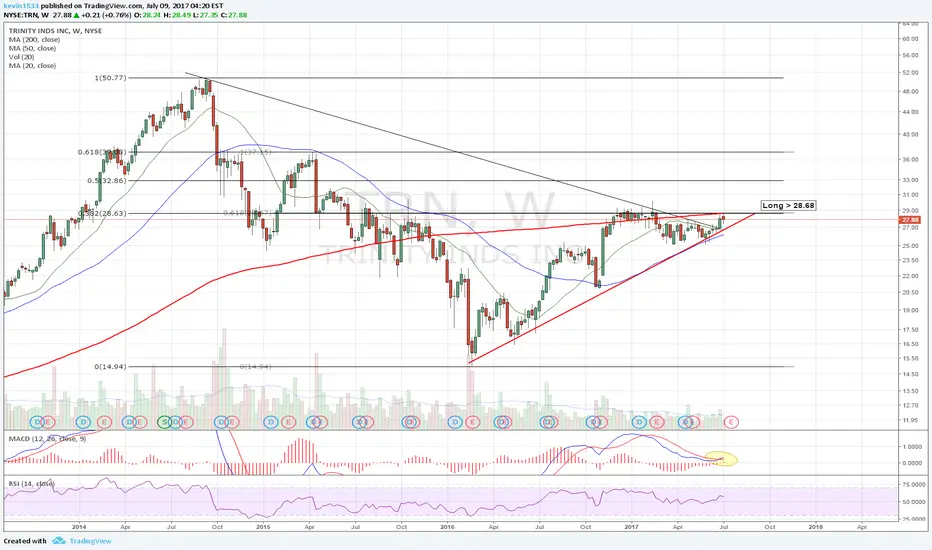
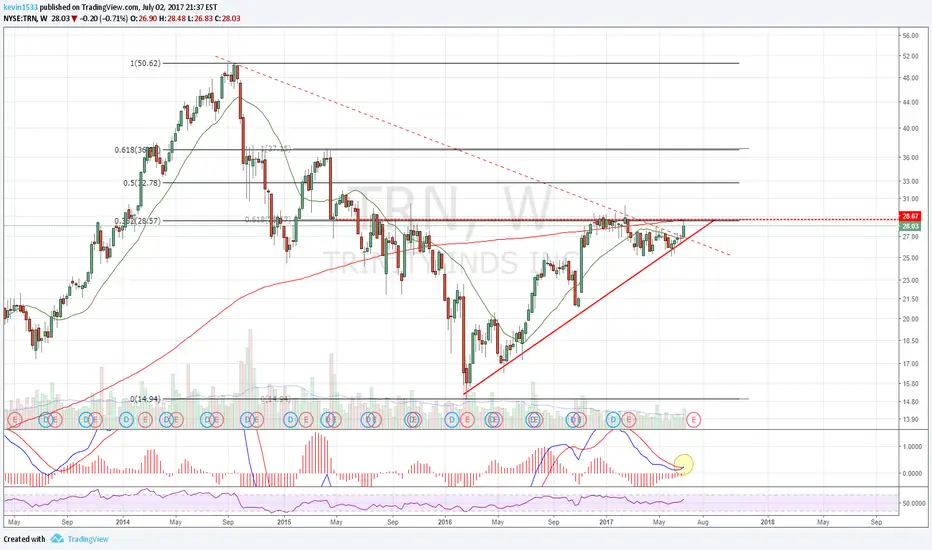
$TRN approaching breakout point after building a 13 month base!* Solid earnings
* Strong up trend
* Pays dividends
* Sector: Industrials - Railroads
* Relative Strength vs. Sector: 1.83
* Relative Strength vs. SP500: 1.19
* U/D Ratio: 1.37
* Base Depth: 31.63%
* Distance from breakout buy point: -3.17%
* Volume 41.24% above its 15 day average
Trade Idea:
*
1.180EUR
96.04 MEUR
2.70 BEUR
80.75 M
About TRINITY INDUSTRIES INC.
Sector
CEO
E. Jean Savage
Website
Headquarters
Dallas
Employees (FY)
9.48 K
Founded
1933
ISIN
US8965221091
FIGI
BBG000J6B9V9
Trinity Industries, Inc. engages in the provision of rail transportation products and services in North America. It operates through the following segments: Railcar Leasing and Management Services Group, Rail Products Group, and Corporate and Other. The Railcar Leasing and Management Services Group segment owns and operates a fleet of railcars and provides third-party fleet leasing, management, and administrative services, as well as other railcar logistics products and services. The Rail Products Group segment manufactures and sells railcars and related parts and components and provides railcar maintenance and modification services. The company was founded in 1933 and is headquartered in Dallas, TX.

Testing the Bear Part III've developed a bearish algorithm/screener that screens for stocks with identified selling pressure / trend followed by a dead cat bounce that is likely to fail - which we will attempt to short. I'm trying to combine trend following and VFI trading principles for the coming bear market.
Components

Die Melvin DieEmbrace the reflexivity. You see bubble, you long till wrong.
Melvin Capital has a short position on this. It's 2 times the daily volume. IV is cheap. So I'm here to lend a hand out. Let's see if his daddy Ken Griffin's bailout was enough for this poor poor fella. If not, I will always remember you

TRN - Highly Shorted Stock Looking BullishThe stock price has been rising since a double bottom in early October. It broke out of a downtrend today with the price finding support on a level where the price gapped up. This area is also where the 200-EMA line is. Today's short float on this stock was 11.71%. Price targets are noted on the cha


TRN SWING and ride the waveTRN, should be a safe bullish play. Enjoy the Wave as this stock bounces off the support and pushes up through February.

See all ideas
Trade directly on the supercharts through our supported, fully-verified and user-reviewed brokers.


Frequently Asked Questions
Depending on the exchange, the stock ticker may vary. For instance, on SWB exchange TRINITY INDUSTRIES INC. stocks are traded under the ticker TTA.
TRINITY INDUSTRIES INC. is going to release the next earnings report on May 1, 2024. Keep track of upcoming events with our Earnings Calendar.
One year price forecast for TRINITY INDUSTRIES INC. has a max estimate of 28.855 EUR and a min estimate of 27.925 EUR.
TTA earnings for the last quarter are 0.25 EUR whereas the estimation was 0.24 EUR which accounts for 0.82% surprise. Estimated earnings for the next quarter are 0.58 EUR. See more details about TRINITY INDUSTRIES INC. earnings.
TRINITY INDUSTRIES INC. revenue for the last quarter amounts to 776.94 M EUR despite the estimated figure of 664.56 M EUR. In the next quarter revenue is expected to reach 688.21 M EUR.
Yes, you can track TRINITY INDUSTRIES INC. financials in yearly and quarterly reports right on TradingView.
TTA net income for the last quarter is 56.90 M EUR, while the quarter before that showed 20.62 M EUR of net income which accounts for 175.90% change. Track more TRINITY INDUSTRIES INC. financial stats to get the full picture.
Yes, TTA dividends are paid quarterly. The last dividend per share was 0.26 EUR. As of today, Dividend Yield (TTM)% is 4.09%. Tracking TRINITY INDUSTRIES INC. dividends might help you take more informed decisions.
TRINITY INDUSTRIES INC. dividend yield was 3.99% in 2023, and payout ratio reached 83.40%. The year before the numbers were 3.21% and 121.56% correspondingly. See high-dividend stocks and find more opportunities for your portfolio.
Like other stocks, TTA shares are traded on stock exchanges, e.g. Nasdaq, Nyse, Euronext, and the easiest way to buy them is through an online stock broker. To do this, you need to open an account and follow a broker's procedures, then start trading. You can trade TRINITY INDUSTRIES INC. stock right from TradingView charts — choose your broker and connect to your account.
As of Apr 18, 2024, the company has 9.48 K employees. See our rating of the largest employees — is TRINITY INDUSTRIES INC. on this list?
We've gathered analysts' opinions on TRINITY INDUSTRIES INC. future price: according to them, TTA price has a max estimate of 28.86 EUR and a min estimate of 27.93 EUR. Read a more detailed TRINITY INDUSTRIES INC. forecast: see what analysts think of TRINITY INDUSTRIES INC. and suggest that you do with its stocks.
EBITDA measures a company's operating performance, its growth signifies an improvement in the efficiency of a company. TRINITY INDUSTRIES INC. EBITDA is 553.84 M EUR, and current EBITDA margin is 20.49%. See more stats in TRINITY INDUSTRIES INC. financial statements.